Stock Market Blog
Daily stock market analysis, trade alerts, and trading education from Ross Givens and the Traders Agency team.

Your #1 Goal in Trading is This
Too many traders think the goal is to win every trade. But that’s impossible. Here is what you should be aiming for instead.

Stock Market Today: VIX Spikes 11% on Chip Rout
Stock market today: VIX jumps 11% as chip selloff and SpaceX slide hit stocks. See why traders are rotating into Treasuries for safety.

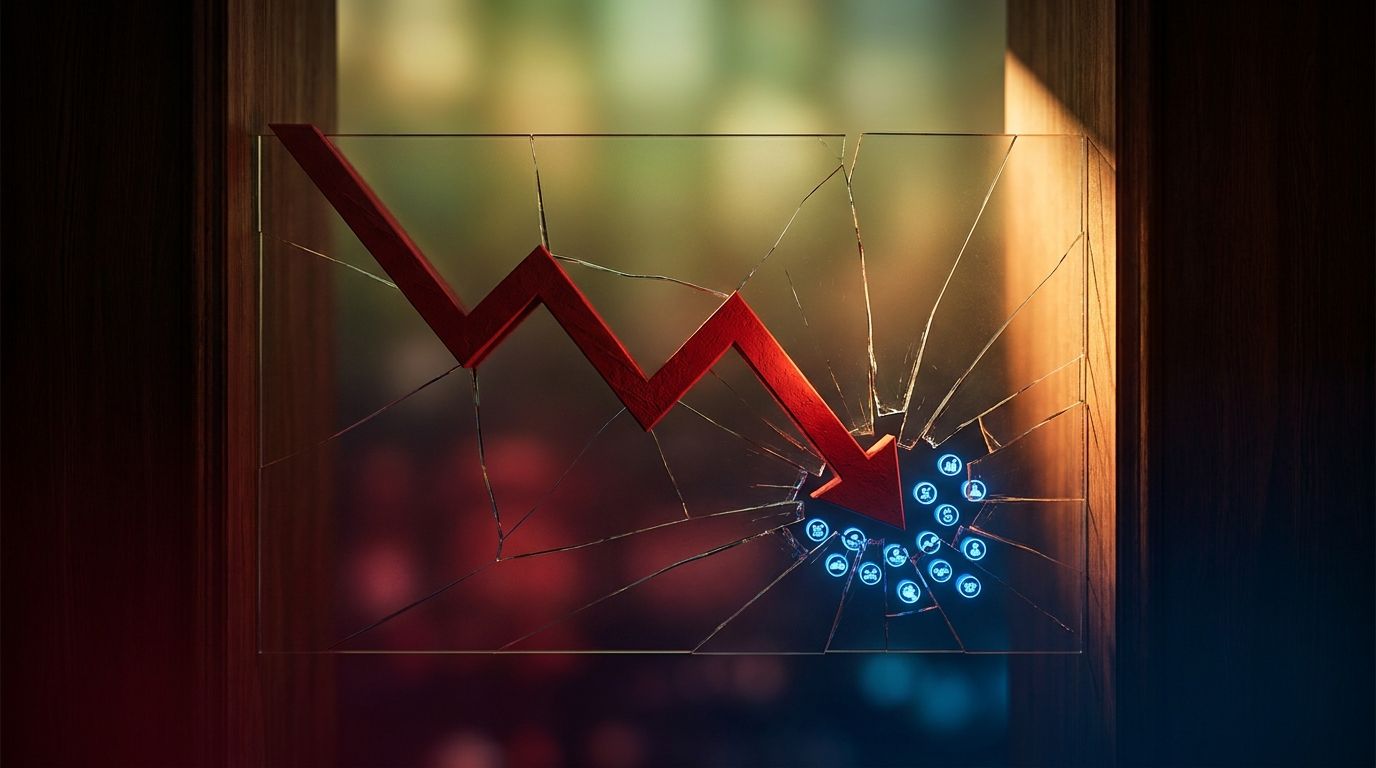
Revenue Growth vs Profit Margins: What Matters More
Revenue growth vs profit margins: learn which metric reveals real value and how to spot cash-burning traps before you trade.

NVIDIA's Next Big Bet Isn't AI… It's Physical AI
Nvidia investments shift toward humanoid robots as one pure-play stock emerges. See why smart money is targeting physical AI now.

Why Is the Nasdaq Down Today: Chip Sell-Off
Why is the Nasdaq down today? Chip stocks tank and Netflix's weak forecast drag Nasdaq, S&P 500, Dow lower -- what traders should watch next.

Global Stocks Drop Today: Chip Rout Sparks Rotation
Global stocks drop today as a semiconductor rout drags tech lower while oil surges. See why traders are rotating into energy this week.

Volume Profile Analysis
Learn volume profile analysis to spot institutional accumulation, hidden support/resistance, and trade key price levels with precision.

Confusing Money Flows
Money flows have been violently rotating over the past 12 months – all in one confusing mess. How can any trader spot the opportunity within?
Market Correction 2025: 40% Drop Warning
Wealth manager warns market correction 2025 could hit 40%. See sentiment data, risk signals, and overlooked stock bargains before it hits.

Stock Market Today: Chips Sink, Staples Surge
Stock market today saw Nasdaq drop 1.5% as TSM's spending forecast tanked chip stocks, while Consumer Staples jumped 2.8% on defensive rotation.

How You Can be Right and Still Lose Money in the Markets
You can be 100% right about the markets – and still lose money. Today’s edition explains why – and how not to fall into this trap.
Stop watching.
Start winning.
50,000+ traders get our daily brief before the market opens.
You're subscribed!
Check your inbox.
Free. No spam. Unsubscribe anytime.
