
Hey, Ross here:
How have the “money flows” been changing over the past 12 months?
Why does that matter right now?
Let’s take a look.
Chart of the Day
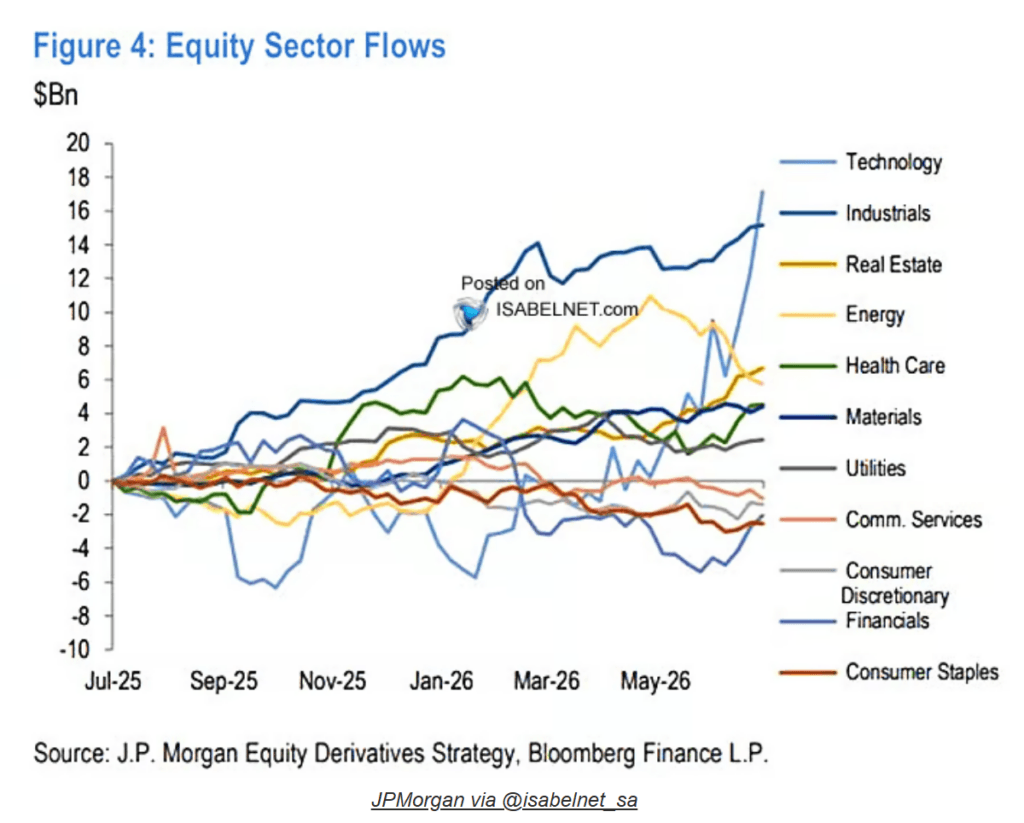
Take a look at this chart.
It shows how money has flowed through the major stock sectors over the past 12 months.
Technology and Industrials have pulled in the most money.
Meanwhile, money has generally flowed out of areas like Consumer Discretionary and Consumer Staples.
But beyond that…
The chart is a mess.
Lines rise. They fall. They cross. Then they reverse again.
And that’s exactly why I showed it to you.
Because broad sector flows can point you toward a rotation…
But they cannot tell you which individual stock to trade.
And they definitely cannot tell you when to get in.
I explain below.
Insight of the Day
Money doesn’t flow into “hot” sectors evenly
A sector can have billions pouring into it…
And still contain plenty of lousy stocks that go nowhere.
Because money never flows into a sector evenly.
It piles into a handful of names first.
Those stocks start holding up better.
They press against resistance.
Then a clean breakout pulls in the next wave of buyers.
That’s why the sector chart above looks so messy – and why it doesn’t tell us much.
It shows you the broad movement of money.
But for us as individual traders, we need to see a clean signal on an individual stock chart.
That is where the trade becomes visible.
That is where we get the opportunity to target the explosive breakouts in these hot sectors.
That’s why in just a few hours at 11 a.m. Eastern…
I’m going LIVE to demo my #1 pattern for targeting the most explosive breakout stocks in these sectors.
This pattern has helped identify moves of 270% in 70 days… 177% in 11 days… even 148% in just two days.
I’ll walk you through it step-by-step.
And I’ll even give away the name and ticker of a top setup that’s forming right now.
So click here to guarantee your free seat if you haven’t already…
And I’ll see you in just a bit at 11 a.m. ET.
P.S. If you’re planning to attend on a mobile device, make sure you download the presentation app now so you don’t miss anything when it starts. See you there.
iOS: https://apps.apple.com/us/app/goto/id1465614785
Android: https://play.google.com/store/search?q=goto&c=apps
Customer Story of the Day
“Ross Givens & Traders Agency have helped me learn & identify market patterns with analysis as to WHEN and how to properly enter and exit trades, with profit!
It’s been 6 months so far, and the education has been excellent, with the profitable trades following!”

Ross Givens
Editor, Stock Surge Daily
See more from Traders Agency on Google
Make us a preferred source and our market analysis will appear more prominently in your Google Search, Top Stories, and AI results.
Add to Preferred Sources