ePlus inc.
ePlus inc. (PLUS) is a $1.6 billion information technology (IT) company focused on optimizing IT and supply chain processes for a variety of industries.
Here’s how the chart is setting up…

And here’s how the stock is setting up with my Stock Surge Indicator (SSI)…
- Surge score: 92/100
- % Above 52-wk low: 38%
- Sales growth: +16%
- Return on Equity: 16%
- Triple momentum: yes
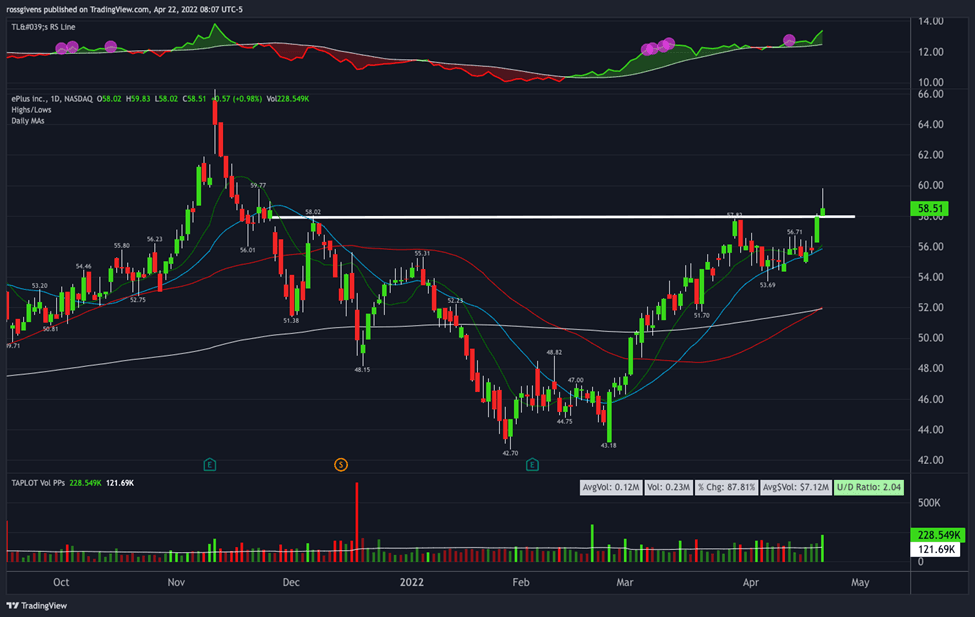
PLUS is a growth stock. As such, it made a good-sized correction at the beginning of this year.
But it is now coming out of a “cup with handle” pattern on good volume.
Moreover, the stock not only held up during the Thursday selloff but actually advanced.
Any stock that can break out and hold under that much selling pressure could see a substantial move higher under better conditions.
I like PLUS near the $58 pivot level with a sell stop at $53.65.
Xenon Pharmaceuticals Inc.
Xenon Pharmaceuticals Inc. (XENE) is a $1.7 billion biotechnology company focused on treating neurological disorders.
Here’s how the chart is setting up…
And here’s how the stock is setting up with my SSI…
- Surge score: 96/100
- % Above 52-wk low: 129%
- Sales growth: -27%
- Return on Equity: N/A
- Triple momentum: yes
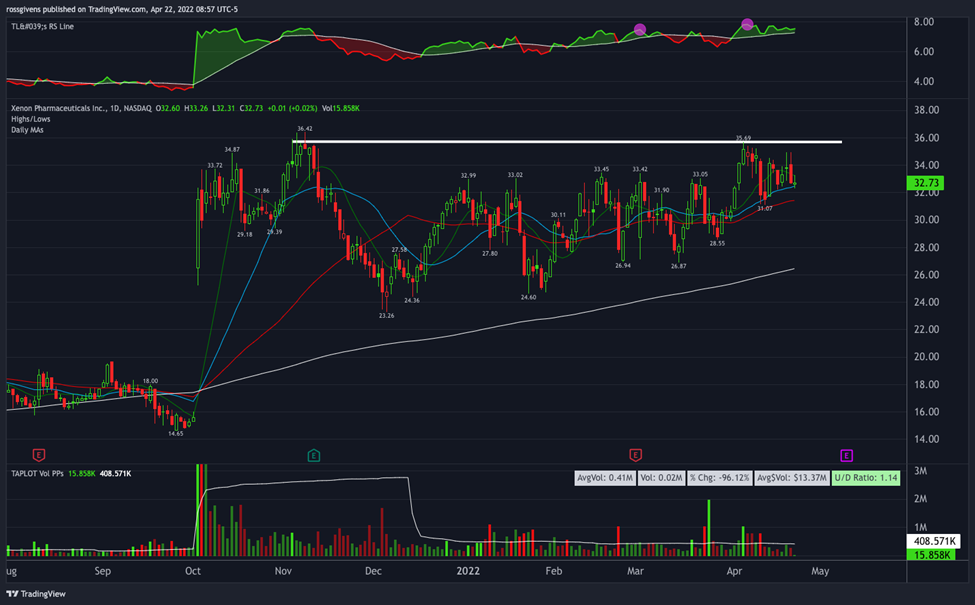
XENE has been on the Watchlist for two weeks now but has yet to break out.
I’m staying patient with this one since larger base patterns like this often lead to the largest breakout moves.
This is a clinical-stage biotech stock, so fundamentals like sales and earnings aren’t much help in evaluating the trade.
But the technicals still look great.
After a big jump in October on positive Phase 2 trial results for its epilepsy drug, shares have consolidated in a tightening pattern from left to right.
Consider buying if the stock breaks above $35.70 on good volume.
AvalonBay Communities, Inc.
AvalonBay Communities, Inc. (AVB) is a $35.4 billion real estate investment trust (REIT) operating 278 apartment communities consisting of 81,803 total units.
Here’s how the chart is setting up…
And here’s how the stock is setting up with my SSI…
- Surge score: 88/100
- % Above 52-wk low: 35%
- Sales growth: +8%
- Return on Equity: 9%
- Triple momentum: yes
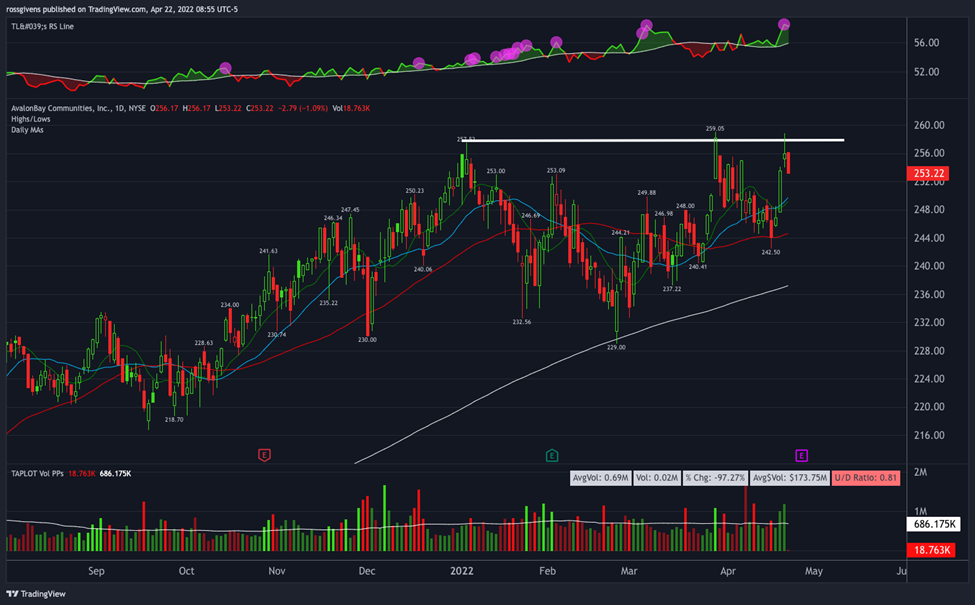
REITs like AvalonBay are attractive investments here since interest rates and inflation are on the rise.
Landlords across the country are raising rents due to rising prices.
With loans already in place at lower fixed interest rates, expenses should remain the same while revenues increase.
This will also create an additional barrier to entry since new landlords would have to finance their purchases at much higher rates.
Consider buying AVB on a move to new highs with a stop at $242.00 for a 6% risk on the trade.
Now, if you’d like a step-by-step walkthrough on how to best take advantage of trades like these…Be sure to check out my article, How to Follow My Weekly Trades, to know where I’m buying so that you can follow along.
The post Watchlist Week of Apr 25th, 2022 appeared first on Stock Surge Daily.
See more from Traders Agency on Google
Make us a preferred source and our market analysis will appear more prominently in your Google Search, Top Stories, and AI results.
Add to Preferred Sources