
Hey, Ross here:
Yesterday, I showed you why the bullish and bearish signals can both be right.
Today, let’s look at what the market itself is telling us.
Because the long-term trend still looks healthy…
But the action underneath has become unusually messy.
Chart of the Day
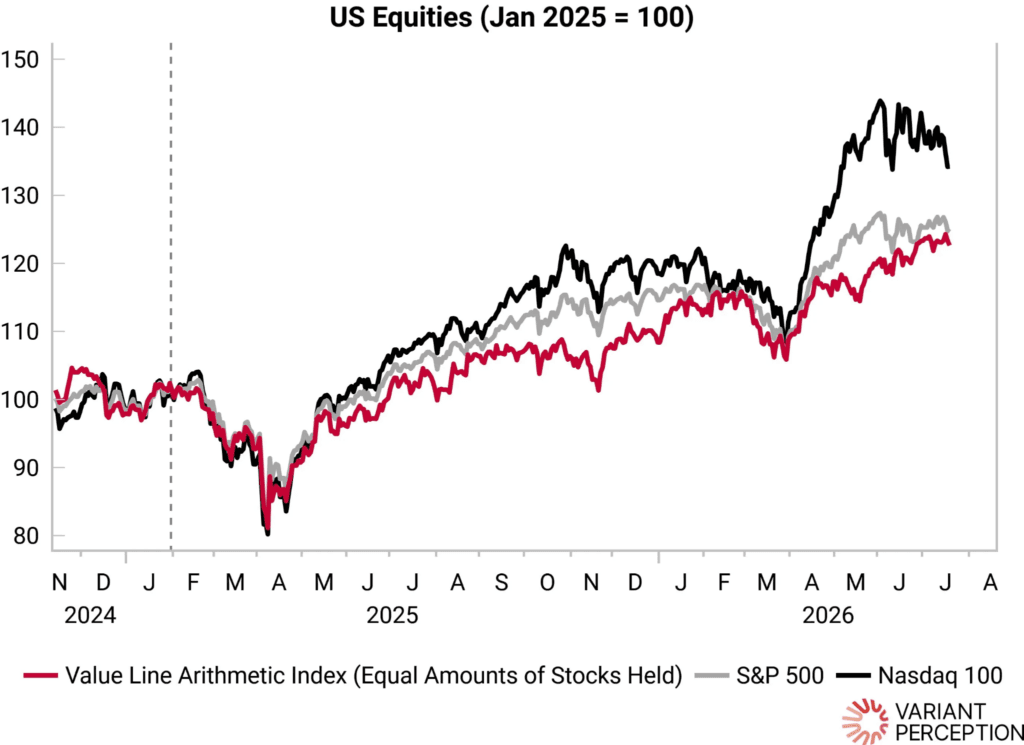
It shows the Value Line Arithmetic Index – a broad gauge of what the average stock is doing.
Unlike the S&P 500, it is not dominated by a handful of giant companies.
Each stock has roughly the same influence.
And despite all the recent noise…
The average stock is still making higher highs and higher lows.
That is not what a major market top usually looks like.
But now look at this next chart.
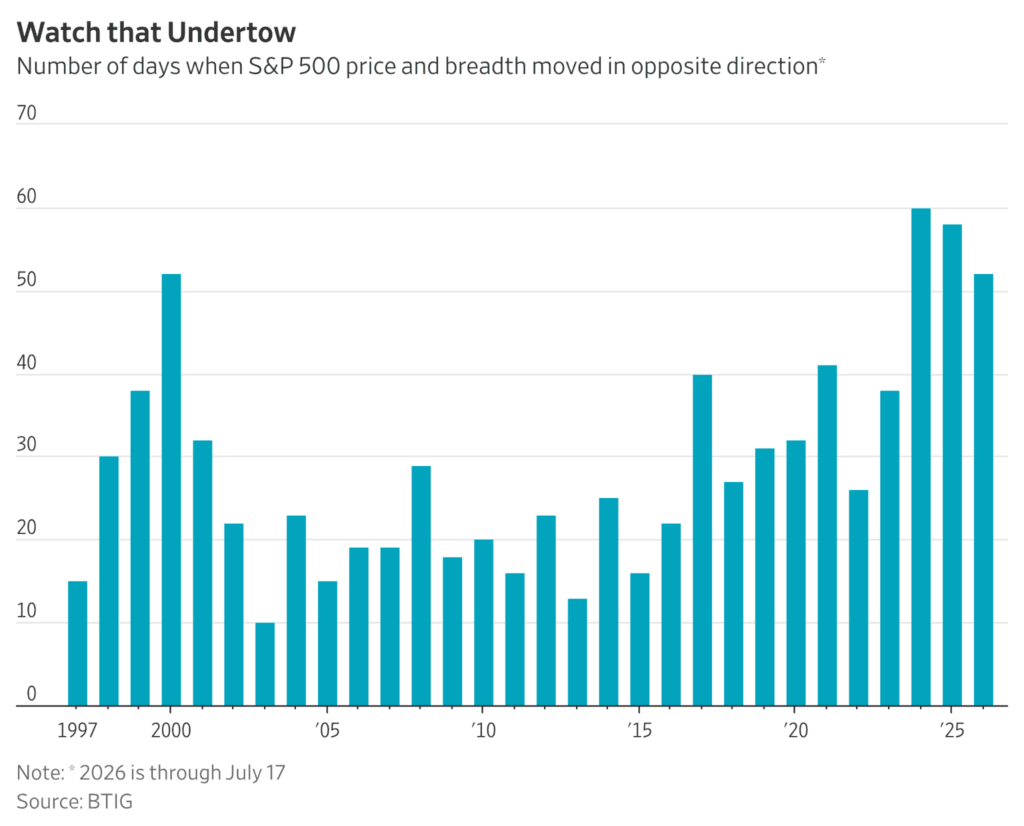
It counts the number of days when the S&P 500 moved in one direction…
While market breadth moved in the other.
Breadth simply tells us how many stocks are participating in the move.
And that has already happened 52 times this year.
We are on pace for one of the most extreme readings ever.
So the average stock is still trending higher…
But from one day to the next, the index and the stocks underneath it keep pulling in opposite directions.
That tells you how violently money is rotating beneath the surface.
And there is one more piece to this.
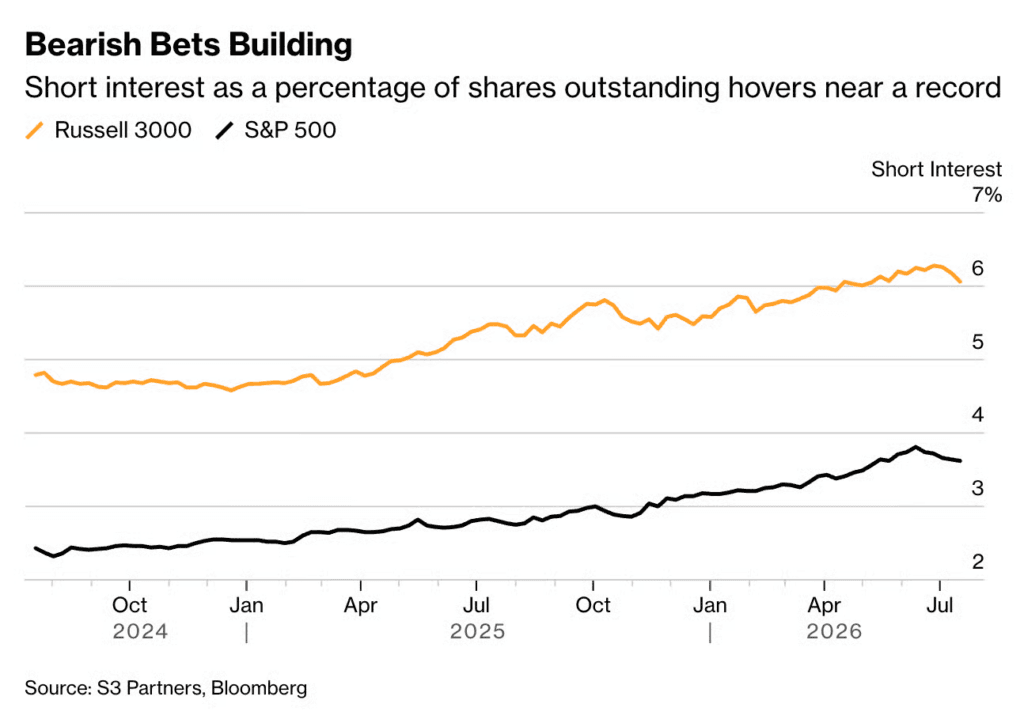
Short interest in both the S&P 500 and Russell 3000 is sitting near record highs.
A lot of traders are betting against individual stocks.
If they are right, the weaker names could get hammered.
But if the market keeps holding up…
Those short sellers may be forced to buy the stocks back.
That is how you get sudden, violent squeezes.
So here is where we stand:
The average stock is still climbing.
Price and breadth keep splitting apart.
And bearish bets are near records.
That is not a simple bull market.
It is not a simple bear market either.
I explain below.
Insight of the Day
A healthy bull market can still be brutal to trade
This is the distinction most traders miss.
A healthy market is not always an easy market.
The average stock can keep grinding higher…
While yesterday’s leaders fall apart.
The S&P 500 can barely move…
While billions rush from one sector into another.
And a heavily shorted stock can explode higher even when the broad market looks quiet.
So simply deciding you are “bullish” is not enough.
You need to know which sectors are gaining strength…
Which trades have become dangerously crowded…
Where the biggest risks are building…
And which stocks are most exposed to the next major move.
That’s why my team and I go LIVE every week to break down the market in real time…
And answer questions like those – so you can find the hottest opportunities no matter what’s happening in the market.
The good news is, if you want to join those sessions…
As part of our “Christmas in July” sale…
You can do so for just 5 bucks for an entire year.
But this deal expires very soon.
So just click here to grab it before it’s gone.
Customer Story of the Day
“Fantastic! Doing well investing with Traders Agency and Ross Givens.
Best decision I have made on this investing journey. Thanks.”

Ross Givens
Editor, Stock Surge Daily
See more from Traders Agency on Google
Make us a preferred source and our market analysis will appear more prominently in your Google Search, Top Stories, and AI results.
Add to Preferred Sources