
Hey, Ross here:
We’re in the middle of a record-breaking earnings season.
And yet…
Uncertainty is creeping back into the market as the Iran war heats up again.
So today, I want to show you three charts that seem to tell three very different stories.
Chart of the Day
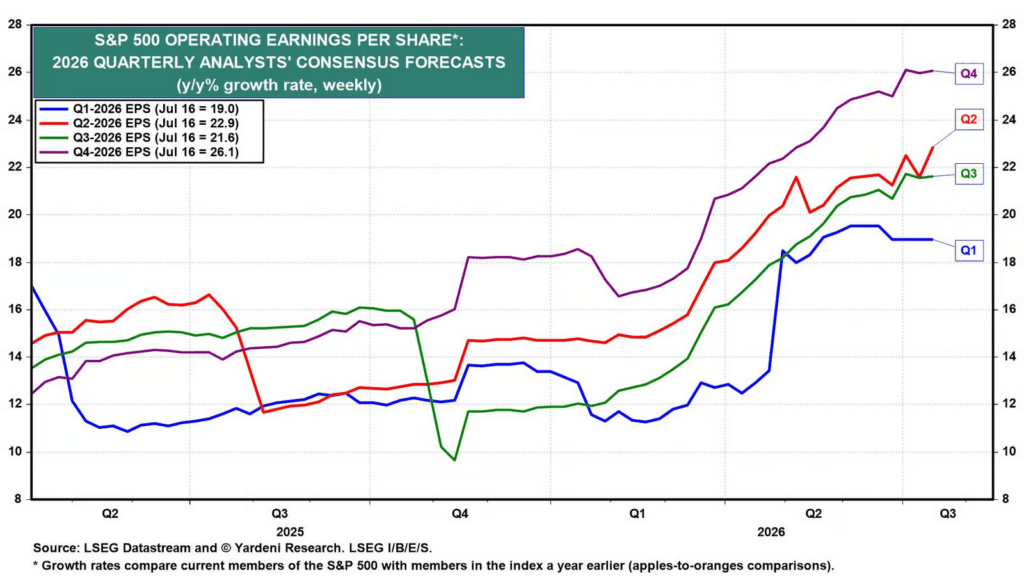
This first chart shows analysts’ earnings-growth estimates for the S&P 500.
And right now, they expect Q2 earnings to grow nearly 23% compared to last year.
That number was just 21.6% a week earlier.
So earnings expectations are not falling as companies report.
They’re still moving higher.
And this is not just the same handful of AI giants carrying the entire market.
Companies outside mega-cap growth and tech are expected to grow earnings by around 14%.
That’s real strength.
But now look at this next chart.
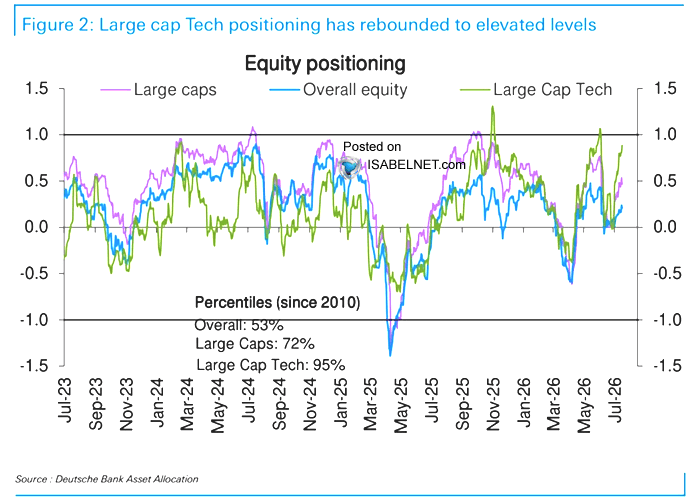
It shows how aggressively investors are positioned in stocks.
Overall equity positioning sits around the 53rd percentile.
In plain English, investors are only modestly overweight stocks.
They’re nowhere close to being all-in.
Large-cap positioning is higher at the 72nd percentile…
But large-cap tech is sitting all the way up at the 95th percentile.
That means although there may still be plenty of money available to move into stocks…
There is not much room left for funds to keep piling into the same giant tech names.
So if fresh money enters the market…
Where does it go?
That’s one question.
But this final chart raises another.
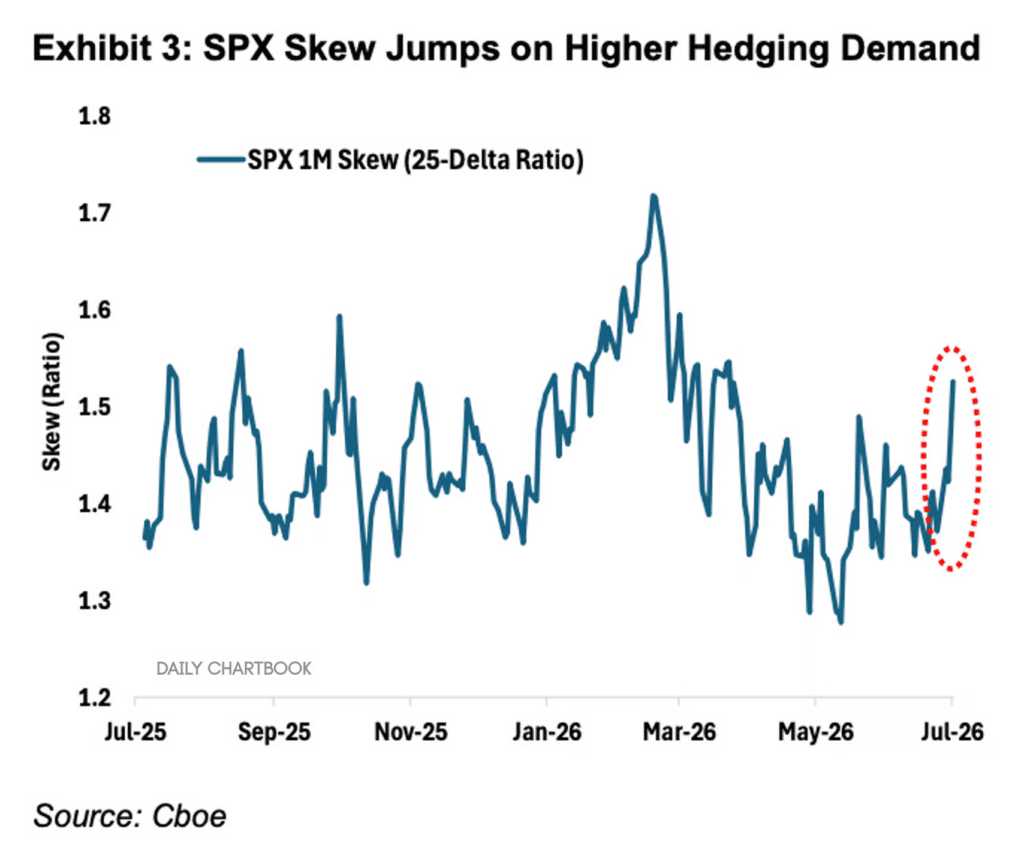
This chart shows SPX skew.
That’s a measure of how much investors are paying for protection against a sharp market selloff.
And last week, skew surged from around the 14th percentile…
All the way to the 82nd percentile.
More investors than ever are hedging themselves against a big drop.
So here’s where we stand:
Earnings are booming.
Overall positioning still leaves room for more buying.
But large-cap tech is packed…
And demand for market protection is rising fast.
So which signal should we trust?
The earnings?
The available buying power?
Or the sudden rush to hedge?
The answer is not as simple as choosing one chart and ignoring the rest.
I explain below.
Insight of the Day
The bull case and the risk case can both be right
This is where traders often box themselves in.
They decide the market has to be either bullish…
Or bearish.
But several things can be true at once.
Earnings can keep powering higher…
While crowded tech trades get sold.
Fresh money can enter the market…
While investors protect themselves against another shock.
The broad bull market can stay alive…
While leadership changes completely beneath the surface.
That may be exactly what we’re setting up for now.
The strong earnings give this market real fuel.
But the crowding in large-cap tech means the next move may not look anything like the last one.
And the spike in hedging tells me investors know the road ahead could get rough.
That does not mean the bull market is over.
It means you cannot look at one index…
One sector…
Or one piece of positioning data…
And assume you understand the whole market.
You need to know how the earnings, positioning, hedging and sector-level price action all fit together…
So you can uncover where the biggest opportunities are.
That’s the reason why my team and I go LIVE every week to break down the market in real time.
If you want to get in on those sessions…
As part of our “Christmas in July” sale…
You can do so for just 5 bucks for an entire year.
Just click here for all the details.
Customer Story of the Day
“I am new to investing and love the help that Ross provides.
I have little means to invest so trying to follow the quick investments to build my cash flow for bigger investments.
Ben was great in leading me to make my membership a lifetime member in the Trading Club and all the services that Ross provides at this time.
I want to be able to have a good retirement and make sure my wife is taken care of if I go, due to my health from exposure to a toxin in my military service.
Watching Ross and speaking with Ben gives me the warmth and great feelings that I have become part of an extended family.”

Ross Givens
Editor, Stock Surge Daily
See more from Traders Agency on Google
Make us a preferred source and our market analysis will appear more prominently in your Google Search, Top Stories, and AI results.
Add to Preferred Sources