
Wall Street ends mixed today, and our team is flagging this session as a key inflection point for tech-heavy portfolios. Healthcare and financial stocks powered the Dow to a record high, while a brutal selloff in semiconductor names dragged the Nasdaq into the red. The data shows a clear rotation out of high-flying artificial intelligence plays and into more traditional sectors. If you're holding concentrated tech exposure, this is the session that demands your attention.
What Were the Final Numbers Behind Today's Mixed Close?
The major indices told three very different stories today. Here's what the tape printed at the close:
- Dow Jones Industrial Average: Surged 1.70% to secure a record closing high
- S&P 500: Reversed early losses to finish up 0.25%
- Nasdaq Composite: Fell 0.17% as technology shares drove the losses
Across the Atlantic, European equities gained ground, with the continent's major bourses rising 0.42% and helping keep global stocks relatively flat. MSCI's global equity gauge slipped just 0.01% on the session.
The Big Number: Broadcom cratered more than 14% in a single session, dragging the entire semiconductor complex lower and exposing the fragility of AI-driven momentum trades.
Why Did Wall Street Split So Sharply?
The answer starts and ends with Broadcom's more than 14% collapse. Investors who had bet on surging demand for custom AI chips were caught offside when the chipmaker's results disappointed. That single stock's weakness rippled across the entire semiconductor group, pulling chipmakers broadly lower.
As James St. Aubin, chief investment officer at Ocean Park Asset Management, put it: "Today's action in tech specifically is emblematic of how fragile sentiment can be for a group of stocks that experience massive gains in a short period of time."
On the other side of the ledger, financial and healthcare stocks absorbed the capital flowing out of tech. The Dow's record close tells us that institutional money isn't leaving equities. It's simply changing addresses.
What Does This Selloff Mean for the Tech Sector?
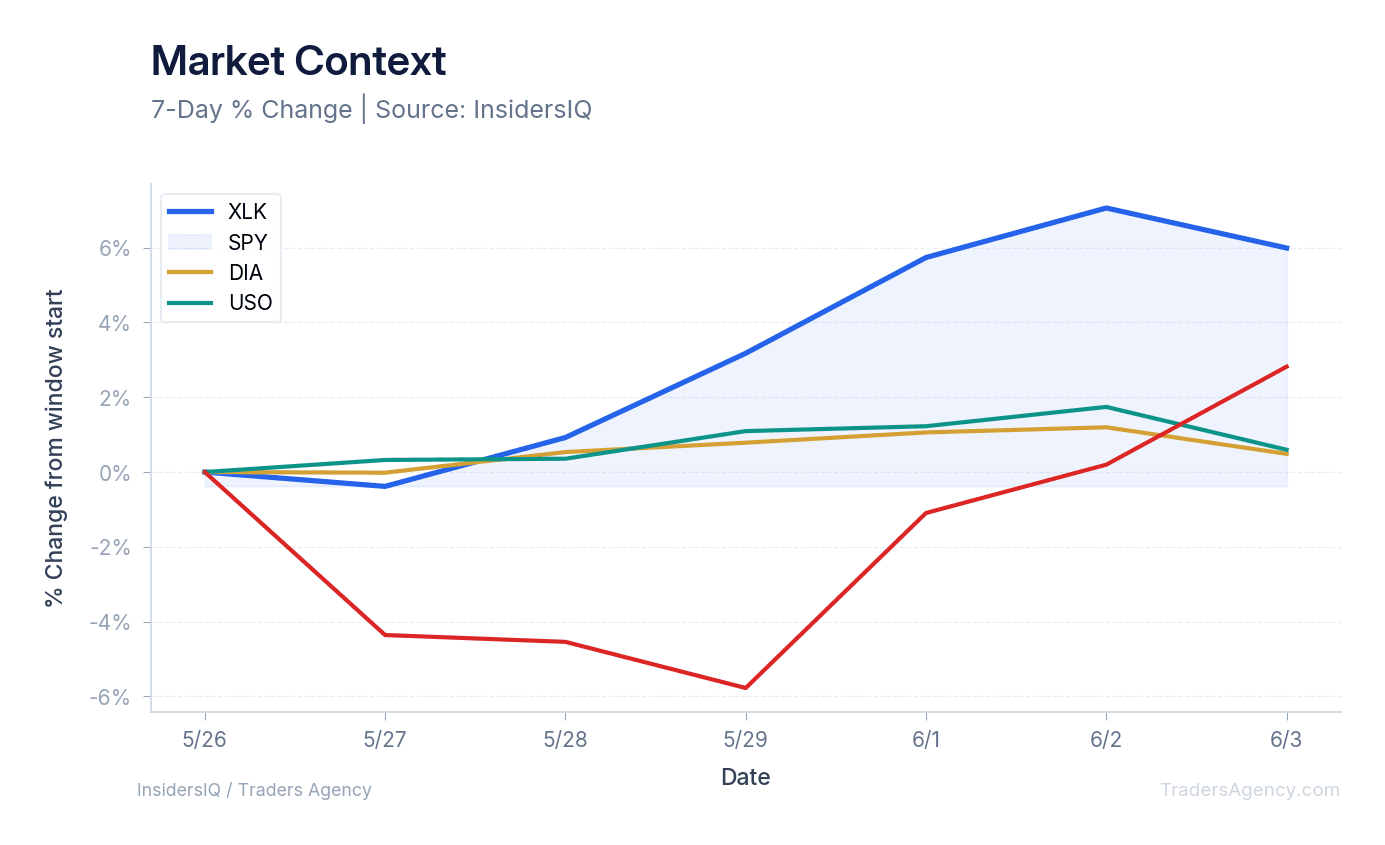
We expect this session to accelerate a rotation within technology as investors question the sustainability of recent AI gains. The Technology Select Sector SPDR Fund (XLK) had been tracking a 10-day price change of +5.99% heading into today's action. That kind of rapid appreciation makes the sector a prime target for profit-taking the moment sentiment cracks.
Compare that to the broader market: SPY shows a 10-day price change of just +0.49%, while DIA tracks at +0.60% over the same period. The gap between tech and everything else had grown unsustainable, and today's session began to close it.
Our team reads the divergence between the Nasdaq and the Dow as a signal that capital allocation is shifting. Traders appear to be locking in tech profits and redeploying into healthcare and financials, sectors that offer earnings stability without the sky-high multiples.
Want expert trading insights delivered daily?
Join thousands of traders who rely on Traders Agency for market analysis and trade ideas.
Join Traders AgencyWhat Falling Crude Means for Energy Traders
Falling crude prices are adding volatility to the energy space following geopolitical developments in the Middle East. Brent crude dropped 3% to fall back below $95 a barrel after a ceasefire between Israel and Lebanon.
The energy markets remain highly reactive to the headline cycle. U.S. President Donald Trump's efforts to halt fighting in Lebanon were undermined after the pro-Iran Hezbollah movement rejected the new ceasefire, and Israel said it would not withdraw troops from the country. We're tracking the United States Oil Fund (USO), which currently shows a 10-day price change of +2.82%, reflecting the whipsaw nature of geopolitical risk premiums in crude.
What Key Signals Should Traders Watch for the Next Session?
Our team has identified three specific data points that will determine where this market heads next. The current Fear & Greed index sits at 68, indicating elevated optimism despite the tech selloff. We're also tracking retail sentiment, with WallStreetBets sentiment at 0.03 across 2,748 mentions.
1. Semiconductor Contagion
Traders need to watch whether Broadcom's more than 14% drop bleeds further into other chipmakers. The tech sector is vulnerable to rapid sentiment shifts, and a second day of selling would confirm a broader de-risking trend rather than an isolated event.
2. Dow Jones Momentum
The Dow Jones Industrial Average hit a record closing high. We're watching to see if financial and healthcare stocks can sustain this leadership role. If the Dow builds on today's gains while the Nasdaq continues to lag, the rotation thesis strengthens considerably.
3. Oil Price Volatility
With Brent crude testing the $95 level, energy traders need to monitor Middle East developments closely. The rejected ceasefire introduces immediate headline risk that could swing crude prices in either direction.
Sentiment Check: The Fear & Greed index at 68 tells us the broader market remains optimistic, but that optimism is concentrated in defensive sectors. Tech traders should treat this disconnect as a warning sign, not a green light.
Our Bottom Line on This Session
When wall street ends mixed with this level of sector divergence, our team looks for rotation opportunities. Broadcom's collapse proves that AI-driven tech stocks are susceptible to sharp pullbacks the moment expectations are missed.
We recommend traders monitor the strength in healthcare and financials while keeping tight risk controls on semiconductor exposure. The Dow's record high tells us money is still flowing into equities. The question is where it's going next, and today's session gave us a strong hint.
Want expert trading insights delivered daily?
Join thousands of traders who rely on Traders Agency for market analysis and trade ideas.
Join Traders AgencyKey Takeaways
- Broadcom collapsed more than 14% in a single session after disappointing AI chip demand results, dragging the broader semiconductor complex lower and pulling the Nasdaq down 0.17%.
- The Dow surged 1.70% to a record closing high, powered by strength in healthcare and financial stocks, confirming that institutional money is rotating out of AI momentum plays.
- The S&P 500 reversed early losses to finish up 0.25%, masking the sharp divergence underneath: traditional sectors rallied while high-multiple tech names sold off.
- European equities gained 0.42% and MSCI's global gauge slipped just 0.01%, suggesting the tech-driven weakness was largely a U.S. semiconductor story rather than a broad global risk-off move.
- Traders with concentrated semiconductor or AI-chip exposure face elevated risk: Broadcom's single-session drop shows how quickly momentum unwinds when earnings miss elevated expectations.
DISCLAIMER: Traders Agency does not offer financial advice. The information provided is for educational purposes only and should not be considered financial advice. Traders Agency is not responsible for any financial losses or consequences resulting from the use of the information provided. Trading carries inherent risks and may not be suitable for all individuals. You are advised to conduct your own research and seek personalized advice before making any investment decisions, recognizing the potential risks and rewards involved.
See more from Traders Agency on Google
Make us a preferred source and our market analysis will appear more prominently in your Google Search, Top Stories, and AI results.
Add to Preferred Sources