
Valuation multiples by sector are ratios that compare a company's stock price or enterprise value to a financial metric like earnings, sales, or EBITDA, and they only mean something when you compare them against the right peer group. A software company trading at 30 times earnings might be cheap. A regional bank trading at 12 times earnings might be expensive. The number alone tells you almost nothing until you know the sector.
By the end of this guide, you'll know how to calculate the three multiples that matter most, where typical ranges fall across major sectors, and how to tell whether a company is genuinely cheap or just cheap relative to a group that deserves to trade low. We'll also show you where to pull this data yourself instead of trusting a headline number you saw on social media.
This matters because misreading a multiple is one of the fastest ways to buy something expensive while thinking you got a bargain.
What Are Valuation Multiples and How Are They Calculated?
Bottom Line: A valuation multiple only tells you something useful once it's measured against the right sector peer group and checked against growth, margins, and history rather than taken at face value. The same P/E or EV/EBITDA number can mean
A valuation multiple divides what the market is willing to pay (price or enterprise value) by a measure of what the business actually produces (earnings, sales, or cash flow). The three we use most often are P/E, P/S, and EV/EBITDA, and each one answers a slightly different question.
P/E (price-to-earnings) is calculated as share price divided by earnings per share. If a stock trades at $80 and earns $4 per share, the P/E is 20. This tells you how many years of current profit it would take to "pay back" the stock price, assuming profits stayed flat.
P/S (price-to-sales) divides market capitalization by total revenue. It's useful for companies that aren't profitable yet, since you can't calculate a meaningful P/E on negative earnings.
EV/EBITDA is the multiple we teach our members to lean on when comparing companies with different debt loads. Enterprise value (EV) equals market cap plus debt minus cash, and you divide that by EBITDA (earnings before interest, taxes, depreciation, and amortization). Because EV accounts for debt, it lets you compare a heavily leveraged company to a debt-free one without the comparison getting distorted.
Key Concept: A valuation multiple is only informative in context. The same number can mean "cheap" in one sector and "expensive" in another, so always anchor your comparison to the right peer group before drawing a conclusion.
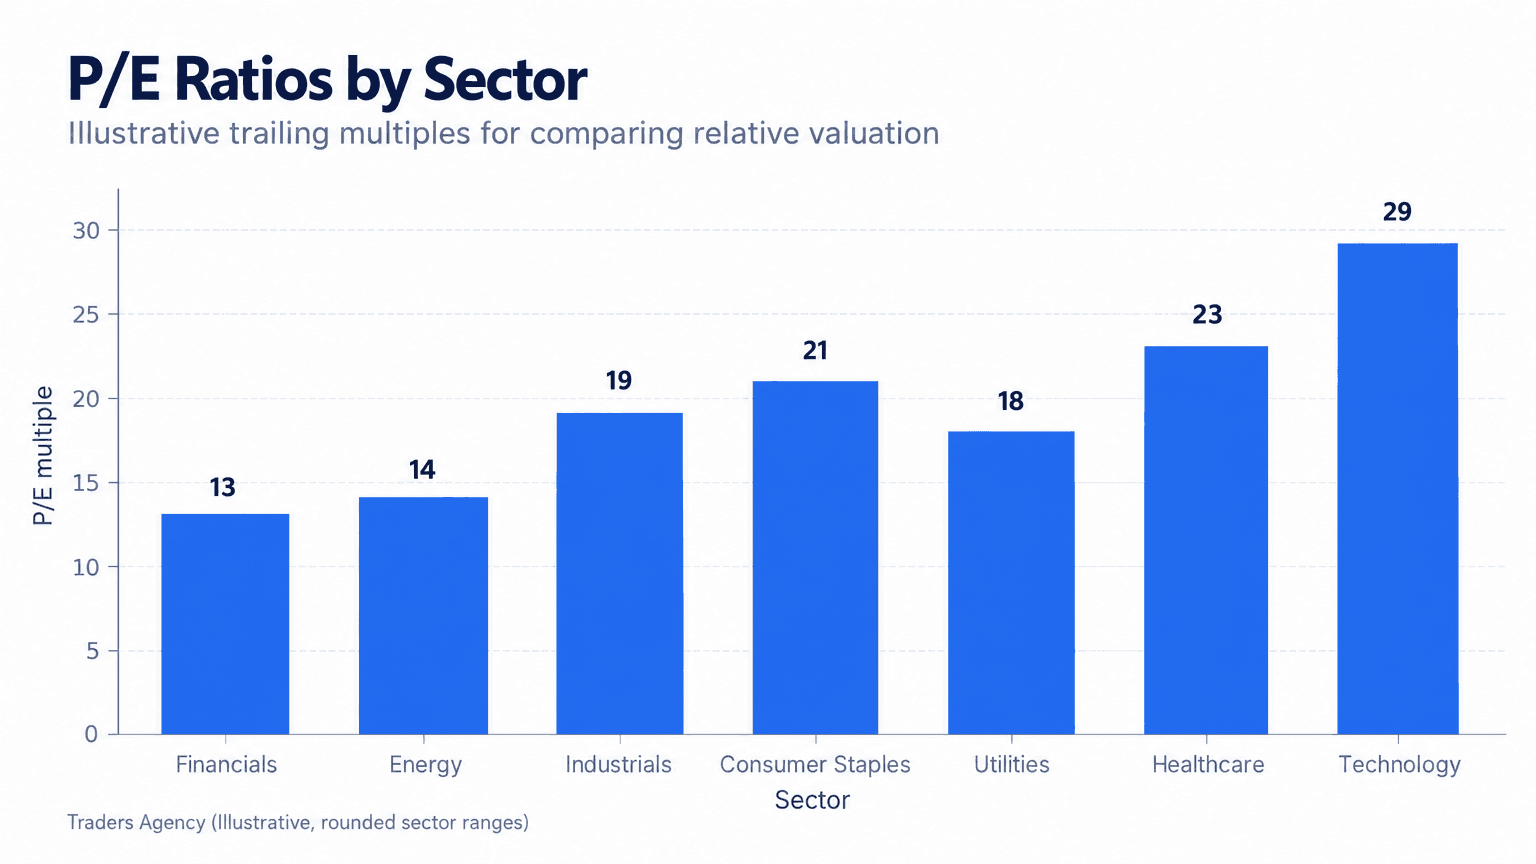
As you can see, P/E ratios cluster in very different ranges depending on the sector. That's the whole point of this guide: a multiple is only informative in context.
Why Do Tech Stocks Trade at Higher Valuation Multiples?
Tech companies trade at higher multiples because the market is pricing in faster growth, higher margins at scale, and lower capital intensity than you'd find in a bank or a utility. Investors are paying up front for earnings they expect several years out, not just this year's number.
A software business can add thousands of new customers without building a new factory. Once the product is built, each additional sale costs very little, so profit margins expand as revenue grows. Compare that to an energy company, which has to spend heavily on drilling, equipment, and maintenance just to keep producing at the same level. That difference in capital intensity is a huge driver of why technology and software multiples consistently sit near the top of the sector range while energy, utilities, and financials sit near the bottom.
There's also a growth-rate effect. If a company is expected to grow earnings 25% a year for the next five years, investors will pay a much higher multiple today than they would for a company growing earnings at 3% a year, even if both companies currently report the same dollar profit. The multiple is really a bet on the future, not just a snapshot of the present.
Key Drivers of Sector Multiple Differences
- Growth expectations: faster expected earnings growth supports a higher multiple.
- Capital intensity: businesses that need heavy ongoing investment tend to trade at lower multiples.
- Margin structure: higher and more scalable margins justify paying more per dollar of current earnings.
- Earnings predictability: stable, recurring revenue (subscriptions, utilities with regulated rates) can support higher or more stable multiples depending on the growth outlook.
- Balance sheet risk: companies carrying heavy debt usually see multiples compressed, since equity holders sit behind creditors.
Want expert trading insights delivered daily?
Join thousands of traders who rely on Traders Agency for market analysis and trade ideas.
Join Traders AgencyWhat Are Typical P/E, P/S, and EV/EBITDA Ranges by Sector?
Here's where we get specific. These are illustrative, rounded ranges meant to show the general pattern you'll see across cycles, not live market data, so always check current figures before making a decision.
- Technology/software: P/E often in the 25 to 40 range, EV/EBITDA frequently 15 to 20+
- Healthcare/biotech: P/E commonly 18 to 30, highly variable due to pipeline risk
- Consumer discretionary: P/E typically 15 to 25
- Industrials: P/E usually 14 to 20
- Financials: P/E often 8 to 13; EV/EBITDA isn't a meaningful measure for banks
- Energy: P/E and EV/EBITDA both tend to run low, often 6 to 10 on EV/EBITDA
- Utilities: P/E moderate (15 to 20), with heavy debt loads making EV/EBITDA the more informative comparison
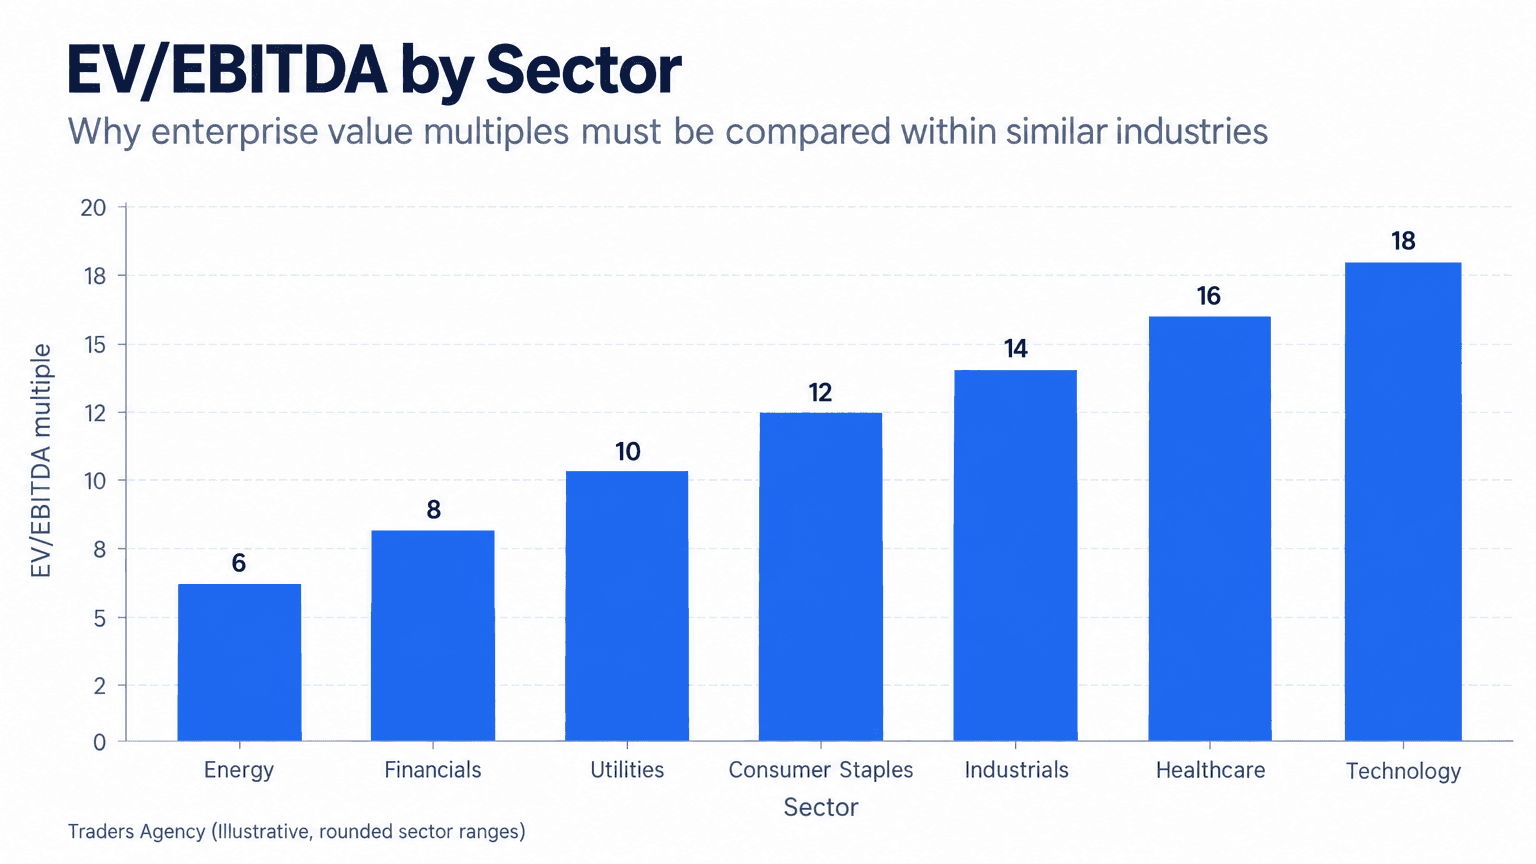
Notice that financials barely appear on an EV/EBITDA chart. Banks carry debt as part of their core business model (deposits are technically a liability), so EV/EBITDA gets distorted. For banks, we teach our members to lean on P/E and price-to-book instead.
Key Concept: EV/EBITDA is a poor fit for financial companies because debt is a core part of how banks operate, not a sign of risk the way it is for an industrial or software company. Use P/E and price-to-book for banks instead.
If you want a broader reference point beyond a single screener, academic valuation databases that break out industry average multiples and update them periodically can be a useful free starting benchmark. Treat these as a sanity check, not gospel, since they update over time and your target company may not match the average exactly.
How Do Valuation Multiples Differ Between Cyclical and Defensive Sectors?
Cyclical sectors (energy, industrials, materials, consumer discretionary) see earnings swing heavily with the economy, so their multiples often look misleadingly cheap at the top of a cycle and misleadingly expensive at the bottom. Defensive sectors (utilities, consumer staples, healthcare) have steadier earnings, so their multiples stay more stable across the cycle.
This is one of the trickiest traps in sector comparison. A cyclical company's P/E can look low (say, 8) right before earnings fall off a cliff, because the "E" in the denominator is at a temporary peak. Conversely, that same company's P/E can look alarmingly high (say, 30) right at the bottom of a recession, because earnings are temporarily depressed, not because the stock got more expensive.
Watch Out: A low P/E on a cyclical stock near the top of its earnings cycle is one of the most common value traps we see. Check where a company sits in its earnings cycle before trusting its current multiple.
We teach our members to check where a cyclical company sits in its earnings cycle before trusting its current multiple. A useful cross-check is looking at EV/sales or a normalized, multi-year average EBITDA instead of relying on a single trailing twelve months figure.
Defensive sectors don't have this problem to the same degree. A utility's earnings don't swing wildly year to year because their revenue is often regulated, so their multiple is a more honest read of valuation at any point in time.
Historical Multiple Ranges and Mean Reversion
Sector multiples don't sit still. They expand when a sector is in favor and compress when sentiment turns, and over a full cycle they tend to drift back toward long-run averages, a pattern known as mean reversion.
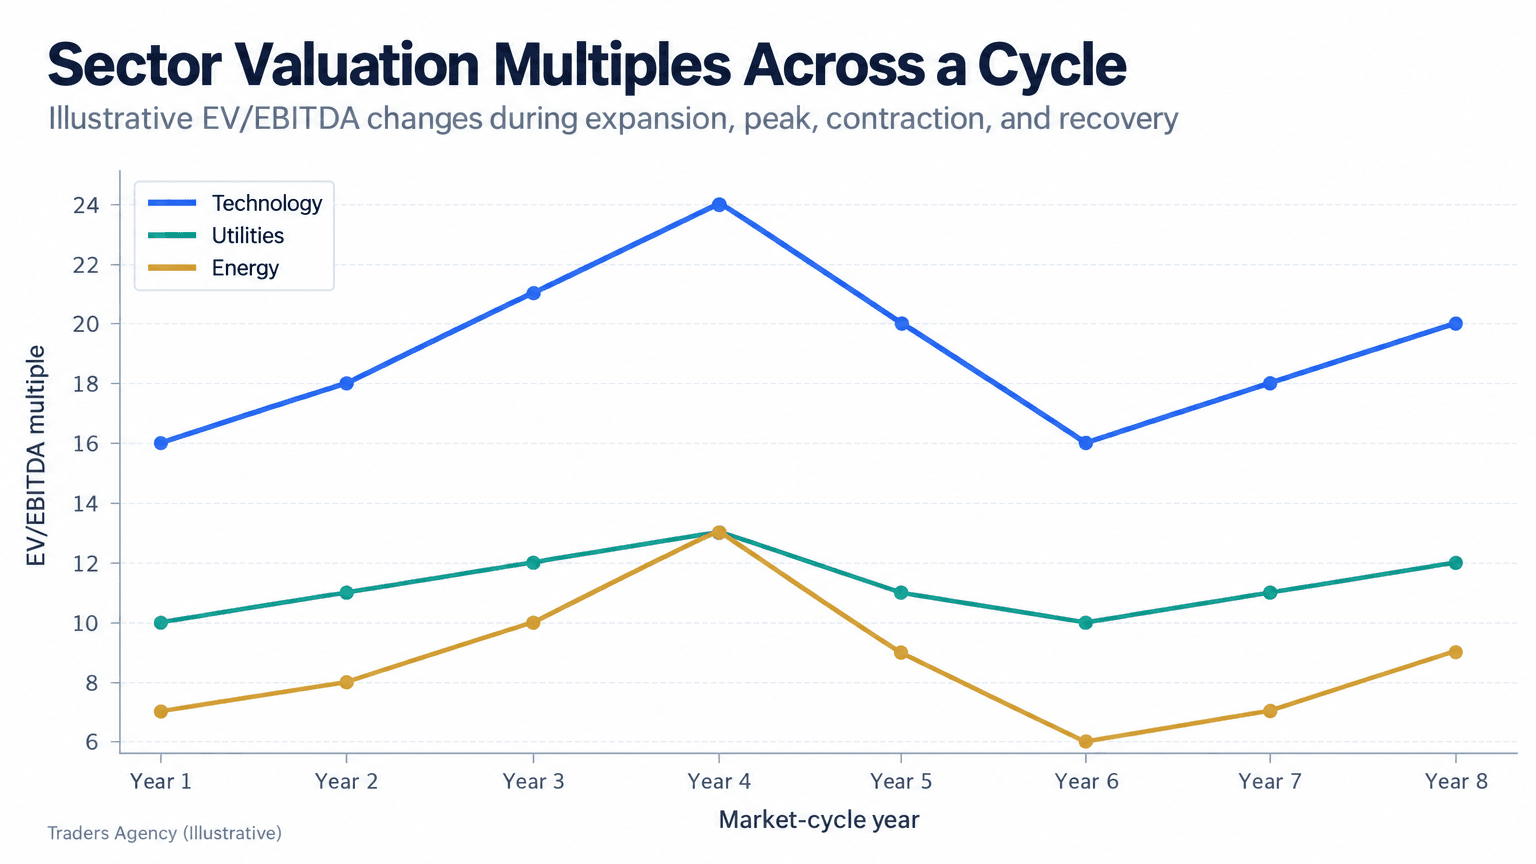
Looking back at 2022, you'll remember that rising interest rates compressed multiples broadly, but technology multiples compressed the most because high-growth, long-duration earnings are the most sensitive to higher discount rates. Energy, by contrast, held up relatively well that year as commodity prices rose and earnings expanded alongside them.
This is a core reason we don't treat any single multiple as a fixed "fair value" line. We treat it as a number that moves within a range, and we ask whether a sector is trading near the top, middle, or bottom of its own historical band before deciding if something looks stretched or discounted.
What Mean Reversion Means for Your Research
- A multiple that's historically high for its sector doesn't automatically mean "overvalued." It may reflect a genuine shift in growth prospects.
- A multiple that's historically low doesn't automatically mean "cheap." It may reflect a genuine deterioration in the business.
- Always compare a company's current multiple to its own sector's historical range, not just to the broader market average.
Where Can You Find Sector Valuation Data in SEC Filings and Screeners?
You don't need a professional data terminal to build this picture yourself. Most of what you need is public, and we walk our members through this process step by step.
- Step 1: Pull the raw numbers from SEC filings. Public companies file 10-K (annual) and 10-Q (quarterly) reports with the SEC, available free through the SEC's EDGAR database. These filings contain the income statement (for earnings and revenue) and balance sheet (for debt and cash), which is everything you need to calculate P/E, P/S, and EV/EBITDA by hand.
- Step 2: Use a free screener for sector averages. Most brokerage platforms and financial data sites let you filter stocks by sector and sort by valuation multiple. This is the fastest way to see where a specific company sits relative to its peers right now.
- Step 3: Check academic and industry datasets. For a broader reference point, industry-level datasets break out average multiples by sector and update them periodically, which is useful for sanity-checking a screener result.
- Step 4: Don't forget private company context. If you're researching a small business or private company benchmarks, remember private transaction multiples are typically lower than public market multiples because private shares are harder to sell (less liquidity) and often carry higher risk premiums. Small business valuation data from business brokers or M&A advisory sources is a separate dataset from public market multiples, so never mix the two when comparing.
Common Mistakes When Comparing Valuation Multiples Across Sectors
This is where most retail investors go wrong, and it's worth slowing down here.
- Comparing across sectors instead of within them. A 25 P/E tech stock and a 25 P/E utility are not equally expensive. The tech stock might be cheap for its sector; the utility might be very expensive for its sector.
- Ignoring growth differences within the same sector. Two software companies can both trade in "normal" tech ranges, but if one is growing revenue at 40% and the other at 8%, they deserve very different multiples.
- Using trailing earnings for cyclical companies at the wrong point in the cycle. As we covered above, this can make a stock look deceptively cheap or expensive.
- Skipping the debt adjustment. Comparing P/E alone when one company has heavy debt and another has none hides real risk differences that EV/EBITDA captures.
- Treating a single multiple as the whole analysis. Multiples are a starting filter, not a final verdict. They tell you where to look closer, not what to buy.
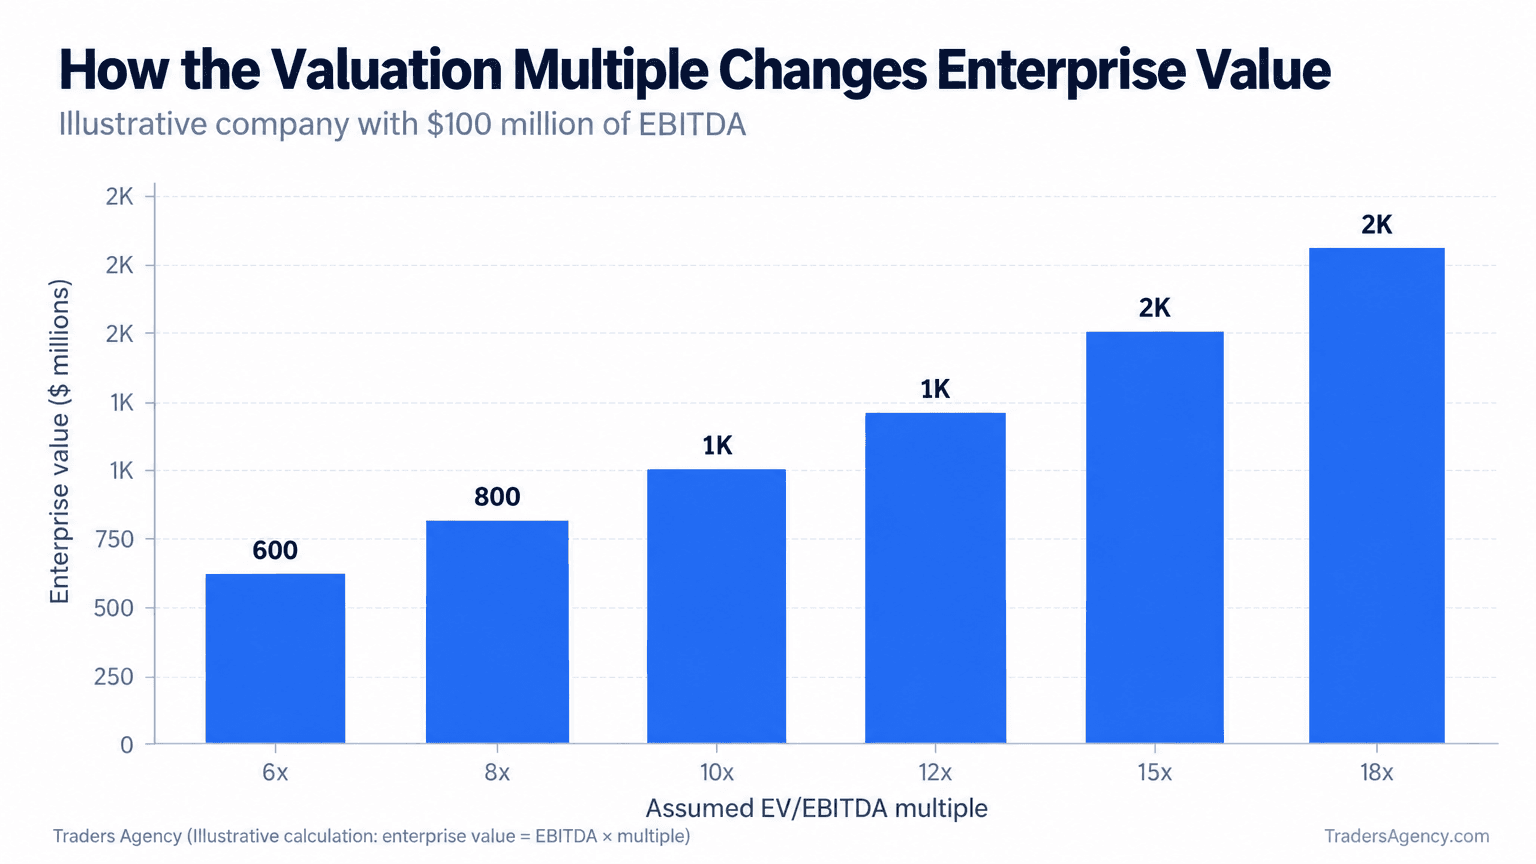
Here's a concrete walkthrough. Say a company reports $150 million in EBITDA. The table below shows how different the implied valuation looks depending purely on which multiple the market assigns.
| Assumed Multiple | Typical Of | Implied Enterprise Value |
|---|---|---|
| 4x EBITDA | Slower-growth industrial business | $600 million |
| 8x EBITDA | Mature, moderate-growth business | $1.2 billion |
| 12x EBITDA | Faster-growing tech-adjacent business | $1.8 billion |
Same EBITDA, wildly different valuation, purely because the market assigns a different multiple based on sector and growth expectations. This is exactly why you can't judge "expensive" or "cheap" without first asking which multiple is appropriate for the business you're looking at.
Watch Out: Never compare raw multiples across sectors without adjusting your expectations for growth, capital intensity, and debt. The same number can mean something completely different depending on the business behind it.
When Should You Use Sector Multiples, and When Should You Avoid Them?
Sector multiples work best as a screening tool, helping you quickly narrow a list of candidates or flag something that looks unusually cheap or expensive relative to peers. They're less useful as a standalone buy or sell signal.
We like using multiples when we're comparing mature companies within the same industry that have similar growth rates and capital structures, since the comparison is closer to apples-to-apples. We avoid leaning on multiples alone when a company has no earnings yet, when it just went through a major acquisition that temporarily distorts EBITDA, or when accounting differences between two companies (like how they capitalize R&D) make the inputs inconsistent.
Fitting This Into a Broader Process
- Use multiples to build a shortlist, not a final decision.
- Cross-check with growth rate and margin trends before concluding something is cheap.
- Size positions based on your own risk tolerance, not just because a stock "looks cheap" on one ratio.
- Revisit the multiple after each earnings report, since the denominator (earnings, sales, EBITDA) changes every quarter.
This is educational information to help you build your own research process, not a recommendation to buy or sell any specific security.
Want expert trading insights delivered daily?
Join thousands of traders who rely on Traders Agency for market analysis and trade ideas.
Join Traders AgencyDISCLAIMER: Traders Agency does not offer financial advice. The information provided is for educational purposes only and should not be considered financial advice. Traders Agency is not responsible for any financial losses or consequences resulting from the use of the information provided. Trading carries inherent risks and may not be suitable for all individuals. You are advised to conduct your own research and seek personalized advice before making any investment decisions, recognizing the potential risks and rewards involved.
See more from Traders Agency on Google
Make us a preferred source and our market analysis will appear more prominently in your Google Search, Top Stories, and AI results.
Add to Preferred Sources