
Market structure trading is a method of reading price charts by tracking the sequence of swing highs and swing lows to determine whether an asset is trending up, trending down, or moving sideways. It sits underneath almost every technical strategy we teach, and once you can label structure correctly, patterns like breakouts, pullbacks, and reversals start making a lot more sense.
You have probably stared at a chart and wondered why price seems to bounce around without any clear direction, only to realize later that it was trending the whole time. That confusion usually comes from not knowing how to read market structure. It is one of the first skills we teach new members because nearly every other approach, from support and resistance to trend-following systems, sits on top of it.
By the end of this guide, you will know how to spot higher highs and lower lows, identify the main types of market structure, and recognize the two signals traders use to catch trend changes early: break of structure (BOS) and change of character (CHoCH).
What Is Market Structure in Trading?
Bottom Line: Reading market structure means tracking swing highs and lows to see who is in control, and watching for a break of structure or change of character before assuming a trend has shifted. Confirming a trend change with multiple signals, rather than reacting to a single swing, helps traders avoid false breaks and manage risk more consistently.
Market structure is the pattern formed by connecting a chart's swing highs and swing lows over time. It tells you whether buyers or sellers are currently in control, and it is the starting point for every market structure trading strategy decision on any timeframe.
Every price chart, no matter the asset, is really just a sequence of ups and downs. A swing high is a peak where price stopped rising and turned lower. A swing low is a valley where price stopped falling and turned higher. When you connect these swings in order, you get a visual story of who is winning the tug-of-war between buyers and sellers.
This matters because price rarely moves in a straight line. It moves in waves, and those waves either build on each other (trending) or cancel each other out (consolidating). Learning to label those waves is the entire skill behind market structure trading for beginners, and it requires no complicated indicators to start.
Key Concept: Market structure is simply the sequence of swing highs and swing lows on a chart. Rising swings mean buyers are in control. Falling swings mean sellers are.
Why This Works
Price structure reflects real supply and demand changing hands. When a stock keeps printing higher highs, it means buyers are consistently willing to pay more than the last peak. That is not random noise, it is a measurable shift in who is being more aggressive.
How Do You Identify Higher Highs and Lower Lows?
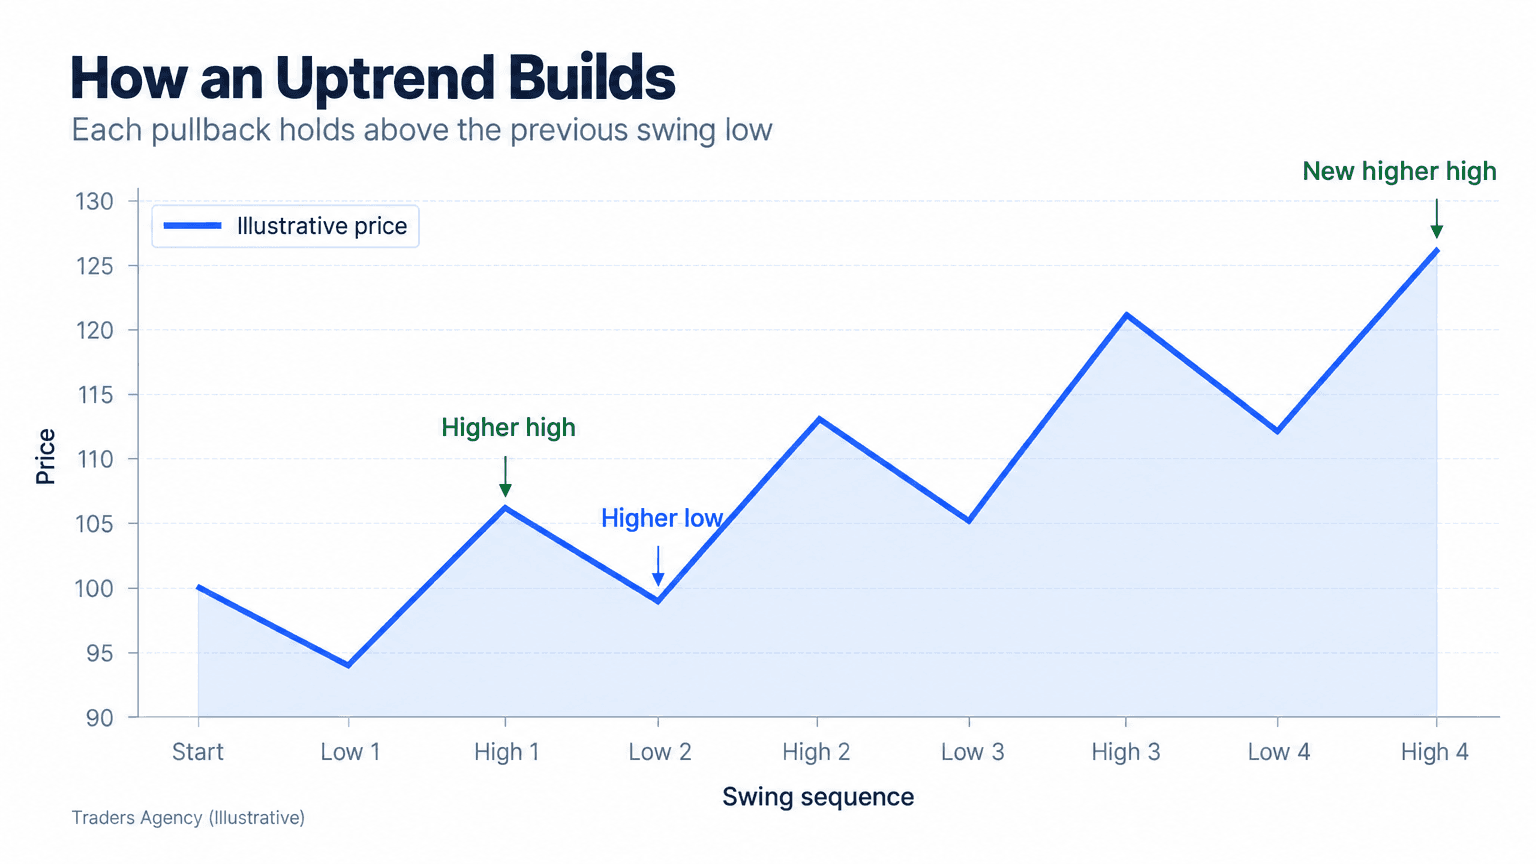
You identify higher highs and higher lows by comparing each new swing peak and valley to the one before it. If both are rising compared to the prior swing, the market is in an uptrend.
An uptrend exists when price forms a swing high above the previous swing high (a higher high), followed by a pullback that stays above the previous swing low (a higher low). Repeat that a few times and you have a clear uptrend. For example, if a stock rallies from $40 to $48, pulls back to $44 (above the prior low of $41), then rallies again to $52, you are looking at a higher low at $44 (above $41) and a higher high at $52 (above $48). That is a textbook uptrend on any timeframe.
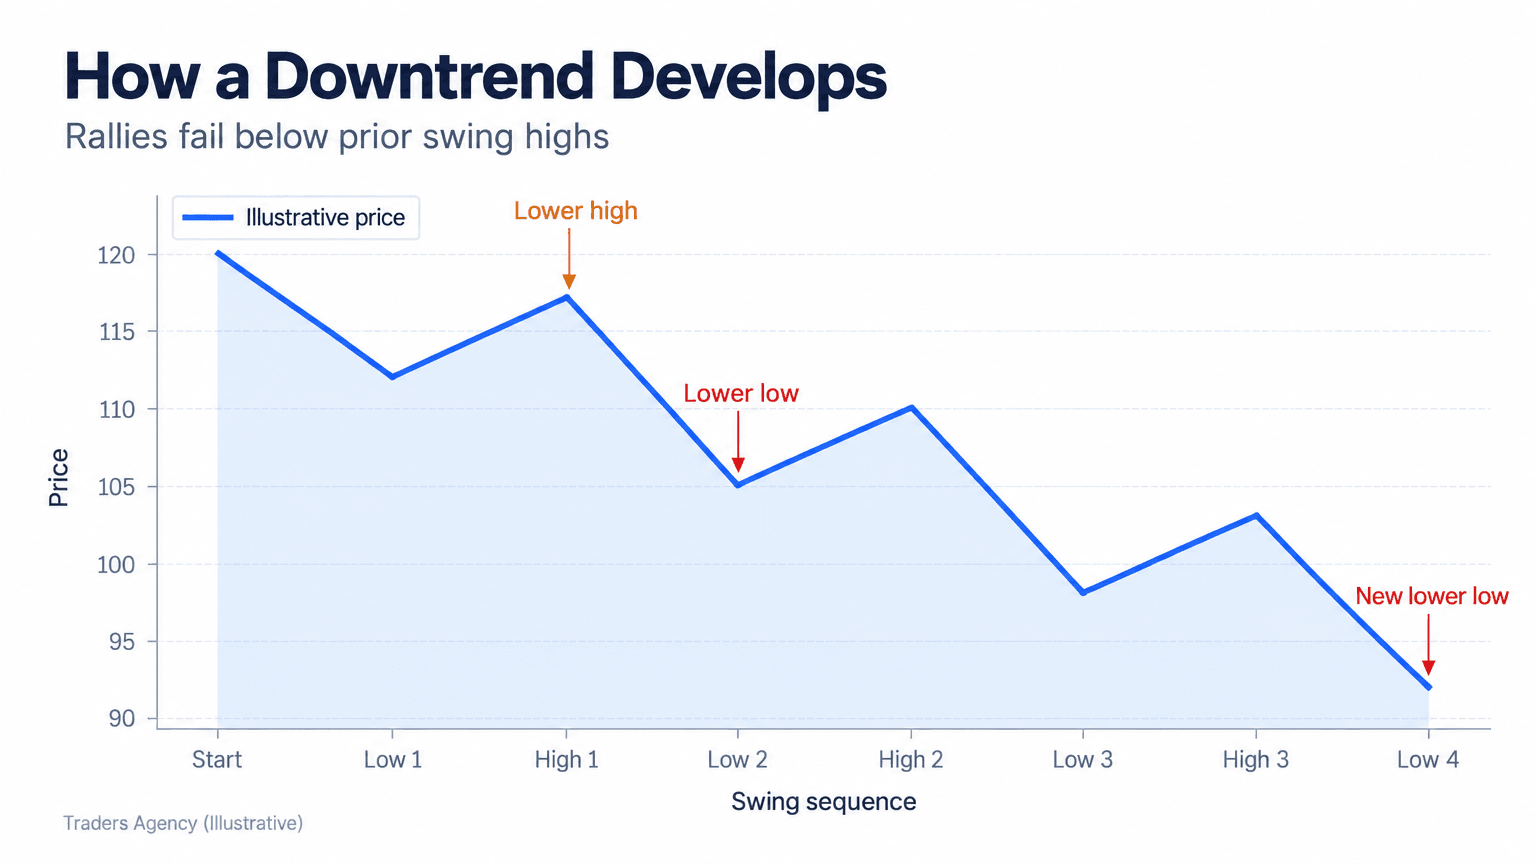
A downtrend is the mirror image: each new swing low falls below the prior swing low, and each bounce fails to reach the previous swing high. Say a currency pair drops from 1.1000 to 1.0800, bounces to 1.0900 (below the prior high of 1.0950), then drops again to 1.0650. That is a lower high followed by a lower low, the signature of a downtrend.
Marking Swings on Your Chart
Our team recommends doing this manually before relying on any automated tool:
- Step 1: Zoom Out – Widen your chart until you can see at least 6 to 8 clear swings.
- Step 2: Mark the Highs – Place a small dot or arrow above each swing high candle.
- Step 3: Mark the Lows – Do the same below each swing low candle.
- Step 4: Label Each Swing – Note whether each one is higher or lower than the swing before it.
- Step 5: Read the Trend – Once labeled, direction becomes obvious without a single indicator.
Most charting platforms, including market structure TradingView tools, offer free drawing scripts that auto-plot swing highs and lows. Those are useful for double-checking your manual work, but we still want newer traders practicing this by eye first. The pattern recognition you build by hand is what sticks.
Want expert trading insights delivered daily?
Join thousands of traders who rely on Traders Agency for market analysis and trade ideas.
Join Traders AgencyWhat Is the Difference Between Break of Structure (BOS) and Change of Character (CHoCH)?
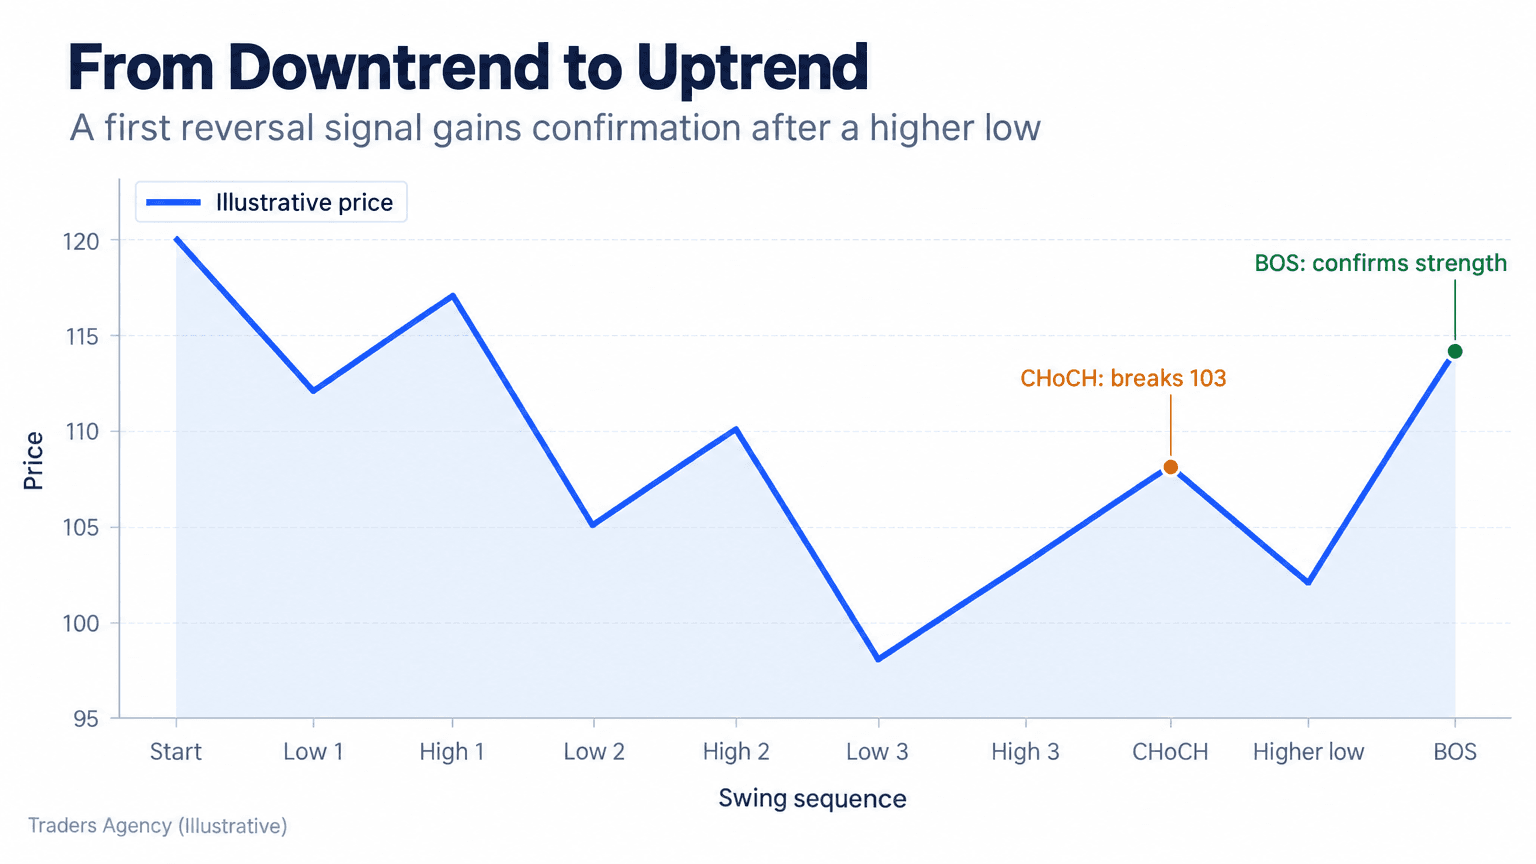
A break of structure (BOS) occurs when price breaks past the most recent swing high or low in the direction of the existing trend, confirming that trend is continuing. A change of character (CHoCH) occurs when price breaks structure against the current trend, an early warning of a possible reversal.
Both terms come from smart money concepts, a framework built directly on market structure analysis. Understanding them is what separates casual chart-watching from an actual trading plan.
Here is the distinction in plain terms. If an uptrend is in place and price breaks above the last higher high, that is a bullish BOS: the uptrend is confirmed and likely continuing. But if that same uptrend suddenly breaks below its most recent higher low, that is a bearish CHoCH, a signal that sellers may be taking control for the first time.
Walking Through an Example
Imagine a stock in a clear downtrend, printing lower highs at $95, $90, and $85 and lower lows at $88, $80, and $72. Sellers are firmly in control.
Then price rallies off the $72 low and pushes above $85, the most recent lower high. That break above a prior lower high is a CHoCH, the first hint that the downtrend's structure is cracking.
Price pulls back slightly, holds above the old low, then rallies further and breaks above $95, an old high from earlier in the downtrend. That is a bullish BOS, confirming the reversal is likely underway.
| Scenario | What Happens After the CHoCH | How We Handle It |
|---|---|---|
| Best Case | The CHoCH marks the exact low and price runs higher for weeks | Hold through the BOS, trail stops under each new higher low |
| Most Likely Case | Price chops sideways before a new trend takes hold | Wait for BOS confirmation instead of guessing the turn |
| Worst Case | The CHoCH fails and the downtrend resumes | Stop placed below the CHoCH low caps the loss |
Key Concept: A CHoCH is a warning that the trend may be turning. A BOS is confirmation that a trend is continuing. One tells you to pay attention, the other tells you the market has committed.
What Are the Four Types of Market Structure?
The four types of market structure are uptrend, downtrend, consolidation (range), and transitional structure, which is the CHoCH/BOS phase where one trend is ending and another may be starting.
We covered uptrends and downtrends above, so here are the other two. Recognizing all four types of market structure in trading helps you avoid forcing trades when conditions do not actually favor your strategy.
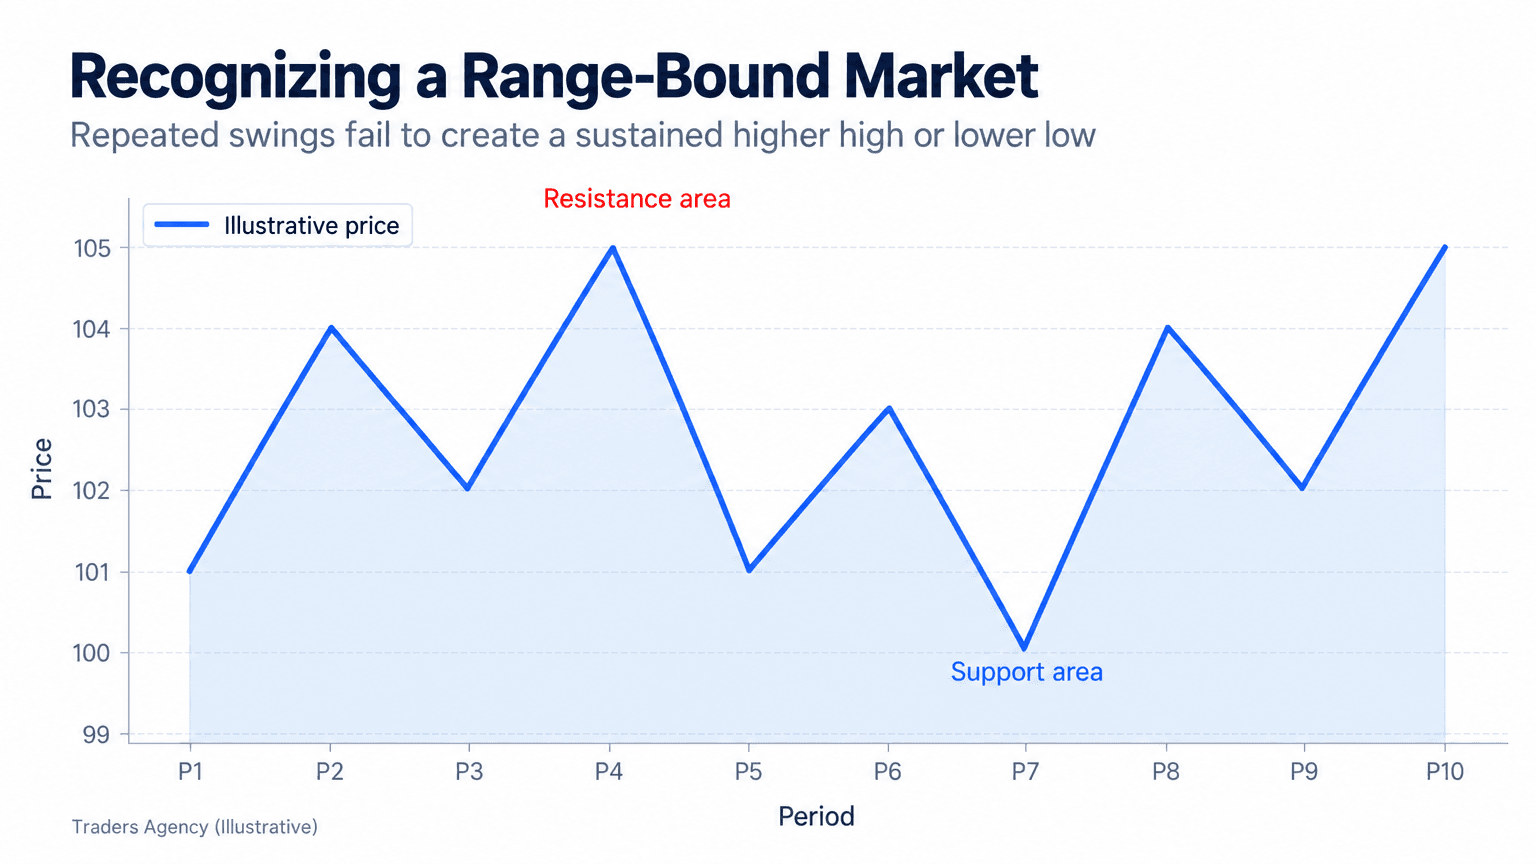
Consolidation happens when price bounces between a fairly consistent support and resistance level without making new highs or lows in either direction. Neither buyers nor sellers have control, so price simply oscillates.
Transitional structure is the CHoCH phase itself: the market has broken its old pattern but has not yet confirmed a new one. This is the highest-risk, highest-reward window, and it is where we spend extra teaching time with members because the timing here is genuinely difficult.
What Factors Determine Market Structure?
A handful of factors shape how reliable your structure read will be:
- Timeframe: structure on a 5-minute chart can look completely different from the daily chart at the same moment.
- Volume: breaks of structure backed by higher volume tend to be more reliable than quiet, low-volume breaks.
- Volatility: choppier assets produce more false swings, which makes structure harder to read cleanly.
- Session timing: in forex market structure trading, structure often shifts meaningfully around the London and New York session opens.
- Prior trend strength: a trend that has been running for months usually needs a stronger CHoCH signal to actually reverse.
How Do You Confirm a Trend Change and Avoid False Signals?
You confirm a trend change by waiting for a full BOS after a CHoCH, ideally supported by increased volume and a retest of the broken level, rather than acting on the CHoCH alone.
False signals are the biggest risk in market structure trading, especially for beginners who jump in the moment they spot one broken swing point. We teach our members to treat a CHoCH as a warning, not a trade signal by itself.
A Simple Confirmation Checklist
- Step 1: Check the Close – Did price close beyond the swing point, or did it just poke through on a wick?
- Step 2: Check Volume – Did volume increase on the break compared to the recent average?
- Step 3: Watch the Retest – Did price retest the broken level and hold, rather than immediately reversing back through it?
- Step 4: Check the Higher Timeframe – Does the larger chart agree with the signal you see on the smaller one?
- Step 5: Map Nearby Levels – Is there a support or resistance level close by that could stall the move?
Combining structure with a simple moving average or RSI reading can add conviction. If a bullish BOS happens while price is also crossing above its 50-period moving average, that is two signals agreeing, which we consider a stronger setup than structure alone. Keep in mind a moving average is derived from price, so it is confirmation, not a fully independent input.
Structure analysis tends to work best on the 4-hour and daily timeframes for swing trading, since lower timeframes produce far more noise and false breaks. Day traders can use 15-minute or 1-hour charts, but should expect more false signals and size positions accordingly.
Watch Out: Acting on a CHoCH before you see a confirming BOS is the single most common mistake we see with this method. One broken swing point is a clue, not a confirmed reversal.
When Should You Use This Strategy?
Market structure trading works best in trending or clearly transitioning markets, and works poorly in tight, choppy consolidation where swing points are unreliable. It fits naturally alongside support and resistance, trendlines, and momentum indicators.
We would avoid relying on structure alone right around major news events, earnings releases, or Federal Reserve announcements, since volatility can create fake breaks that reverse within minutes. Be cautious on very low-volume assets too, where a handful of large orders can distort the swing pattern entirely. For listed options and index products, contract specifications and volume data are available directly from the Cboe.
Risk Management Basics
- Risk no more than 1% to 2% of account equity per trade based on structure signals.
- Place stops beyond the CHoCH swing point, not at an arbitrary dollar amount.
- Wait for BOS confirmation before adding to a position. Do not average in on the CHoCH alone.
- Reduce position size on lower timeframes, where false signals are far more common.
Many traders write these rules down as a one-page plan they keep next to the screen, so decisions are not being made emotionally in the moment. We think that is a smart habit regardless of experience level.
Frequently Asked Questions
What is market structure trading?
Market structure trading is a technical analysis method that reads swing highs and swing lows on a price chart to determine trend direction and spot potential reversals through signals like BOS and CHoCH.
What are the four types of market structure?
Uptrend, downtrend, consolidation, and transitional structure, which is the phase where a CHoCH signals a possible shift between the other three.
Can you make $1,000 a day with day trading?
It is possible on certain trades depending on account size and volatility, but it is not consistent or guaranteed. Most day traders face significant risk of loss, especially early on.
What is the 3-5-7 rule in trading?
It is a risk management guideline suggesting no single trade should risk more than 3% of capital, total open risk across all positions should stay under 5%, and winning trades should aim to return at least 7% more than losing trades cost. Traders adapt the exact numbers to their own tolerance.
Which timeframe is best for market structure trading?
The 4-hour and daily charts tend to give the cleanest, most reliable structure signals, while 1-minute and 5-minute charts produce more false breaks.
Do I need indicators to trade market structure?
No. Structure can be read from price alone, though many traders add volume, moving averages, or RSI for extra confirmation before entering.
Want expert trading insights delivered daily?
Join thousands of traders who rely on Traders Agency for market analysis and trade ideas.
Join Traders AgencyDISCLAIMER: Traders Agency does not offer financial advice. The information provided is for educational purposes only and should not be considered financial advice. Traders Agency is not responsible for any financial losses or consequences resulting from the use of the information provided. Trading carries inherent risks and may not be suitable for all individuals. You are advised to conduct your own research and seek personalized advice before making any investment decisions, recognizing the potential risks and rewards involved.
See more from Traders Agency on Google
Make us a preferred source and our market analysis will appear more prominently in your Google Search, Top Stories, and AI results.
Add to Preferred Sources