
The broader market is flashing warning signs — but one heavily overlooked sector is setting up for a rebound.
While traditional equities face intense pressure, the crypto market is quietly forming textbook breakout patterns. This isn’t about chasing hype. It’s about identifying exhausted supply and taking advantage of clean, low-risk entry points using standard exchange-traded funds.
Geopolitical Weakness Is Real
After a deep dive through every sector — scanning the A-to-Z of businesses for clean setups — the results were painfully clear.
The S&P and the NASDAQ are struggling, weighed down by the war in Iran and the oil situation. Across traditional equities, there’s almost nothing clean out there.
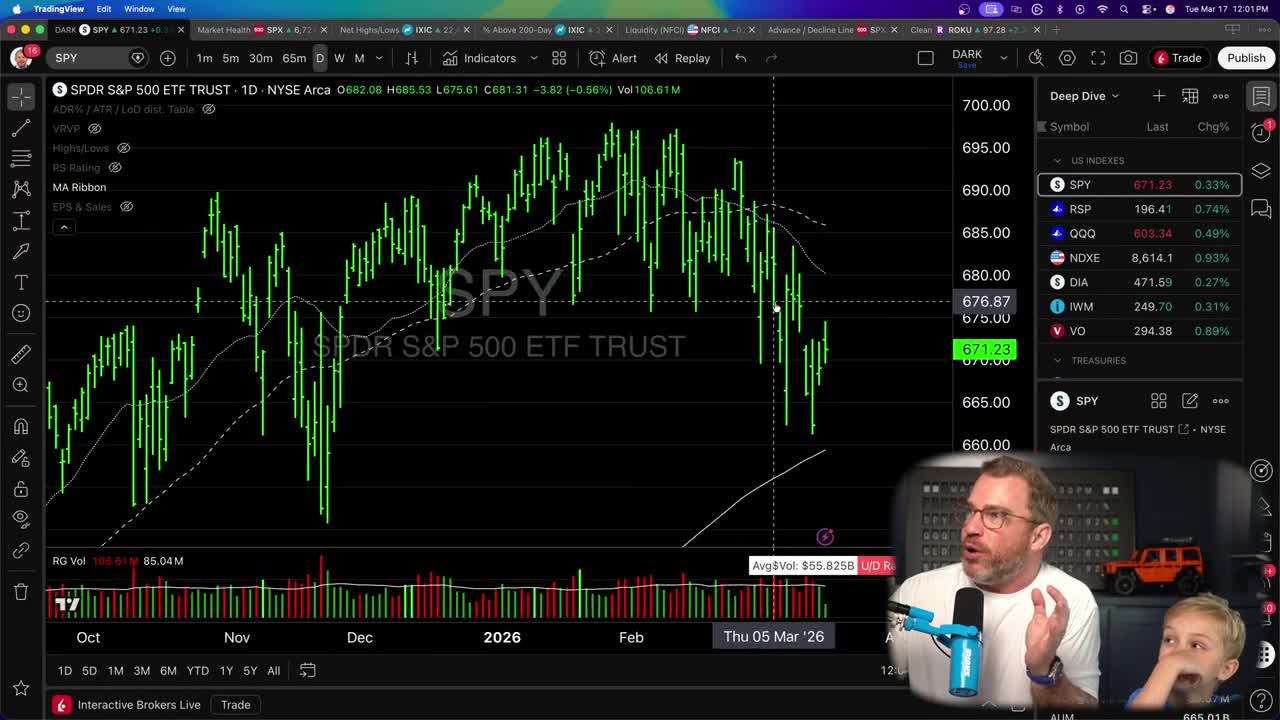
But chaotic markets often hide isolated pockets of opportunity. And right now, exactly one area is showing strong signs of a rebound off the bottom.
Believe it or not — it’s crypto.
Why Crypto Is Ripe for a Rebound
Crypto has been overlooked and underperforming for the past year. The crowd lost interest. That’s exactly when you should start paying attention.
What’s forming right now is a clean shallowing pattern across multiple major digital assets. Cryptocurrencies generally all move together — it’s very rare to see one surging while another collapses. When the tide turns, it tends to lift the entire sector.
XRP looks pretty good. Solana looks good. But two specific assets are showing the best setups for immediate entry.
The Mechanics of Supply Exhaustion
Every good crypto reversal looks exactly the same. The goal is to confirm that supply is exhausted — that sellers have run out of ammunition and buyers are quietly taking control.
It happens through a specific sequence:
First, the absorption of supply. Heavy selling pressure begins to dry up. The suppression gets absorbed by patient buyers stepping in underneath.
Then, the tightening phase. Price action shallows out, forming a textbook shallowing base pattern right off the bottom.
Finally, the breakout. The asset punches through key resistance levels and starts moving.
No Crypto Account Needed
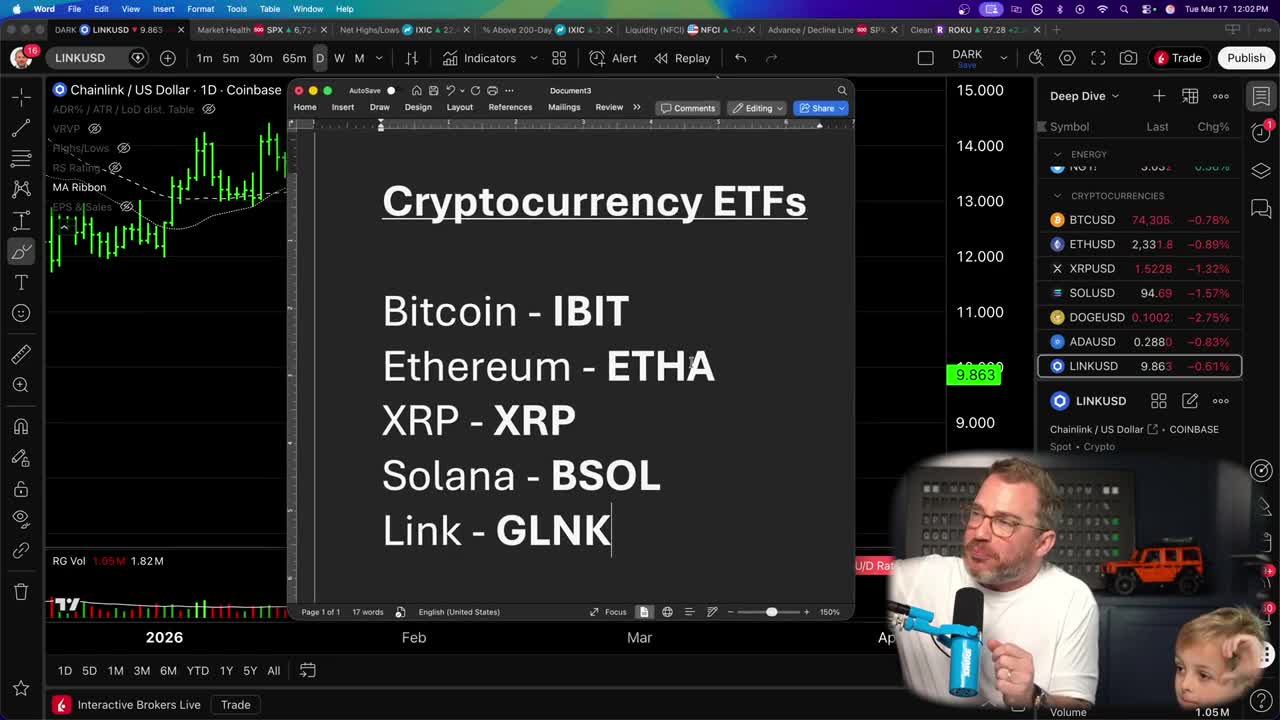
You don’t need a specialized cryptocurrency account to trade these moves. There are ETFs for the big five:
- Bitcoin (IBIT)
- Ethereum (ETHA)
- XRP (XRP)
- Solana (BSOL)
- Link (GLNK)
Buy them directly in any standard stock account. These are the most liquid, highest daily trading volume ETFs for each of these digital assets.
Because cryptos trade 24 hours a day and stocks don’t, the ETF charts aren’t quite as clean as the raw crypto charts. But the exact same shallowing base patterns are forming.
Get an entire year of live weekly mentoring sessions, my newsletter, indicators, bonus reports, tons more. Click the link and I’ll see you in the next live session.
Join my Black Ops Trading ClubThe Ethereum Setup
Targeting a new stage two uptrend
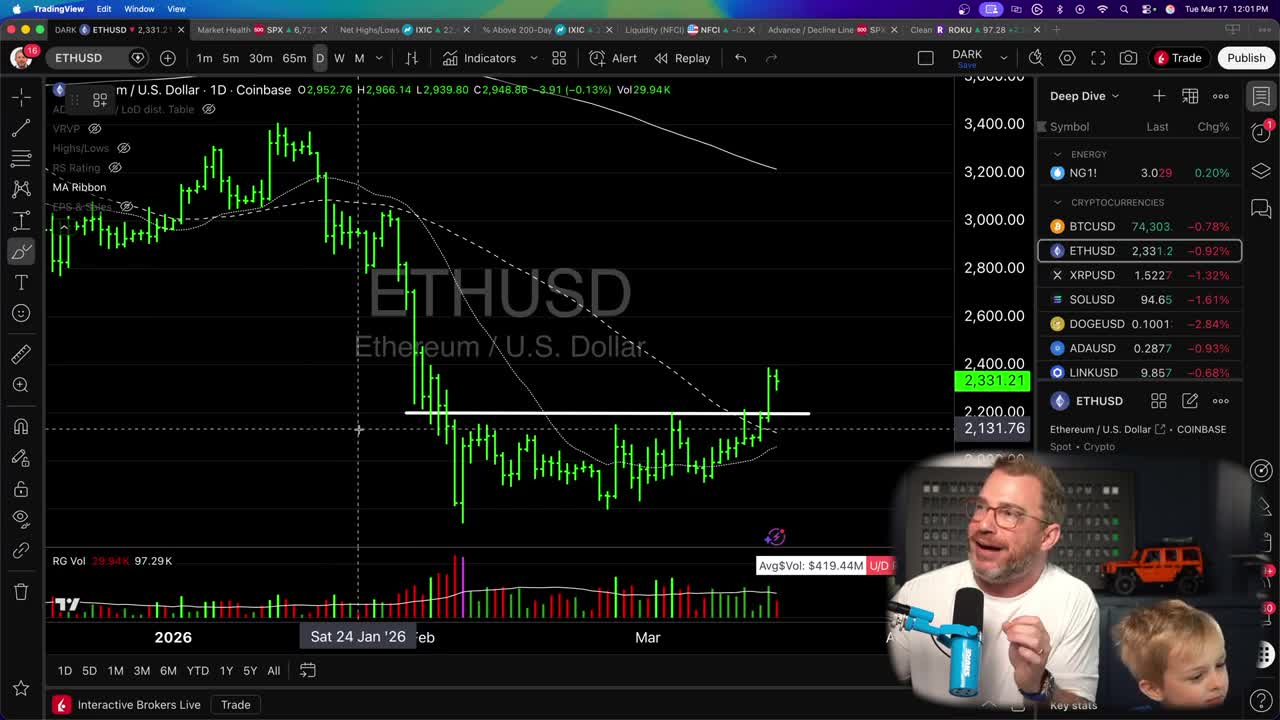
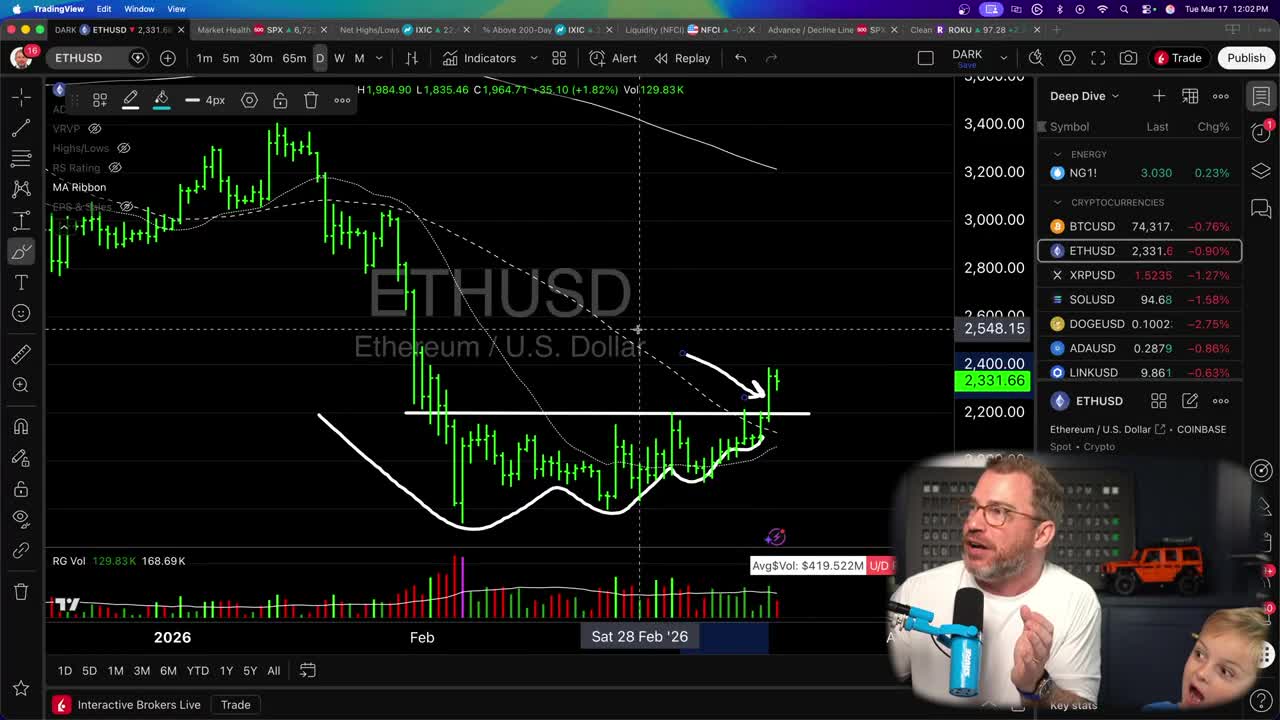
Ethereum (ETH) is showing a perfect entry point. The asset recently pushed through with a big 8% up day, breaking right through the 50-day moving average. The setup points to the start of a new stage two uptrend.
The trade: a long position using the ETHA ETF, which moves pretty much lock, stock, and barrel with Ethereum itself.
A 10% risk for 30-40% upside. That’s the kind of asymmetry worth showing up for.
The Chainlink Setup
A textbook breakout pattern
Link is a thinner, smaller cryptocurrency compared to Ethereum — but the chart looks perfect.
A beautiful 5-day shallowing pattern. Price cuts right through, sitting on the breakout area above the 50-day moving average. Every good crypto reversal looks exactly like this. Not guaranteed — but the pattern is as clean as it gets.
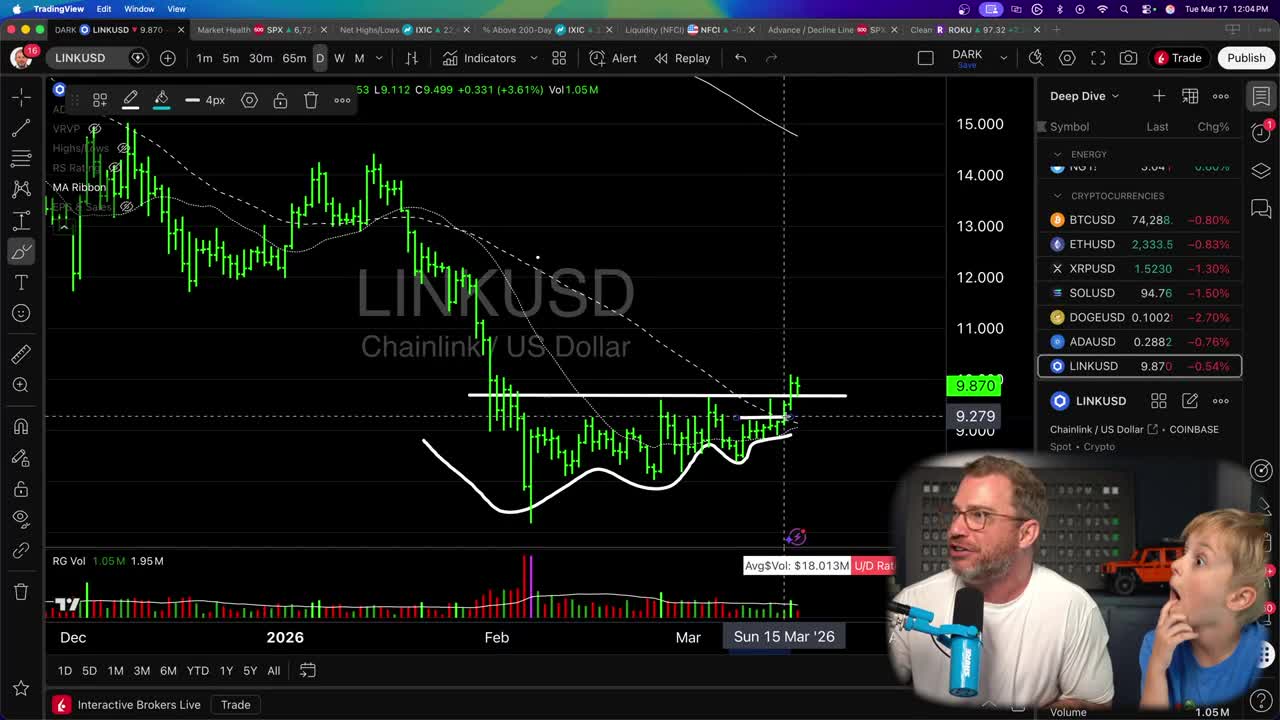
The trade goes through the GLNK ETF.
Order Structure Matters
For both the ETHA and GLNK positions, the stop losses are set as Good Till Cancelled. That way, the protection doesn’t go away at the end of the trading day. The stops stay active, guarding your capital while the trade has room to work.
Low Risk, High Probability
You don’t need to risk a lot of money to take advantage of these setups.
Wait for textbook shallowing base patterns. Use highly liquid ETFs. Define your risk with tight stops. The broader markets may be struggling because of the war in Iran and the oil situation — but crypto is showing strong signs of a rebound off the bottom.
Focus on exhausted supply, manage your downside with tight stops, and let the stage two uptrends do the heavy lifting.
Get an entire year of live weekly mentoring sessions, my newsletter, indicators, bonus reports, tons more. Click the link and I’ll see you in the next live session.
DISCLAIMER: Traders Agency does not offer financial advice. The information provided is for educational purposes only and should not be considered financial advice. Traders Agency is not responsible for any financial losses or consequences resulting from the use of the information provided. Trading carries inherent risks and may not be suitable for all individuals. You are advised to conduct your own research and seek personalized advice before making any investment decisions, recognizing the potential risks and rewards involved.
See more from Traders Agency on Google
Make us a preferred source and our market analysis will appear more prominently in your Google Search, Top Stories, and AI results.
Add to Preferred Sources