
Borrow rates and short squeezes are two of the most misunderstood concepts in retail trading, yet together they explain some of the most explosive stock moves of the past decade. A borrow rate is the fee a short seller pays to borrow shares, and when that fee spikes, it often signals that a short squeeze is building. By the end of this guide, you'll know how to read that signal, where to find the data, and when to trust it versus when to leave it alone.
You've probably seen this happen on a trading forum: a stock no one was talking about a week ago suddenly jumps 40% in a single session, and the comments fill up with people saying "the shorts are trapped." Sometimes that's true. Sometimes it's just noise dressed up as a conspiracy theory. The difference usually comes down to one data point most retail traders never check: the borrow rate.
We'll teach you what borrow rates actually measure, how to track them using real brokerage data, and how to combine that information with short interest and trading volume to spot genuine squeeze setups before they happen, not after the headlines show up.
What Is a Short Squeeze?
Bottom Line: Borrow rates matter because a rising fee combined with shrinking share availability and real volume is a stronger squeeze signal than price action alone. No single metric guarantees a squeeze, so treat these trades as small, high-risk positions with a stop set before entry, not as a prediction of what will happen.
A short squeeze is a rapid price increase caused by short sellers being forced to buy back shares to close their positions, which adds even more buying pressure and pushes the price higher. That's the foundation everything else in this guide builds on.
Here's the mechanical chain reaction. A trader borrows shares and sells them, betting the price will fall. If the price rises instead, that trader faces mounting losses with no ceiling, because a stock's price can theoretically rise forever. At some point, the pain becomes too much, or the broker forces a buy-in, and the short seller buys shares to close the position. That buying adds demand to a stock that may already be rising, which pushes the price up further and forces other shorts to cover too.
The 2021 GameStop episode is the textbook case. Short interest was reportedly over 100% of the float at one point, meaning more shares were sold short than technically existed in the tradeable supply (a result of shares being re-borrowed and re-shorted multiple times). When buying pressure from retail traders began pushing the price up, short sellers were squeezed into covering, and the stock moved from roughly $20 to over $480 in a matter of weeks.
How Do Borrow Rates Signal a Short Squeeze?
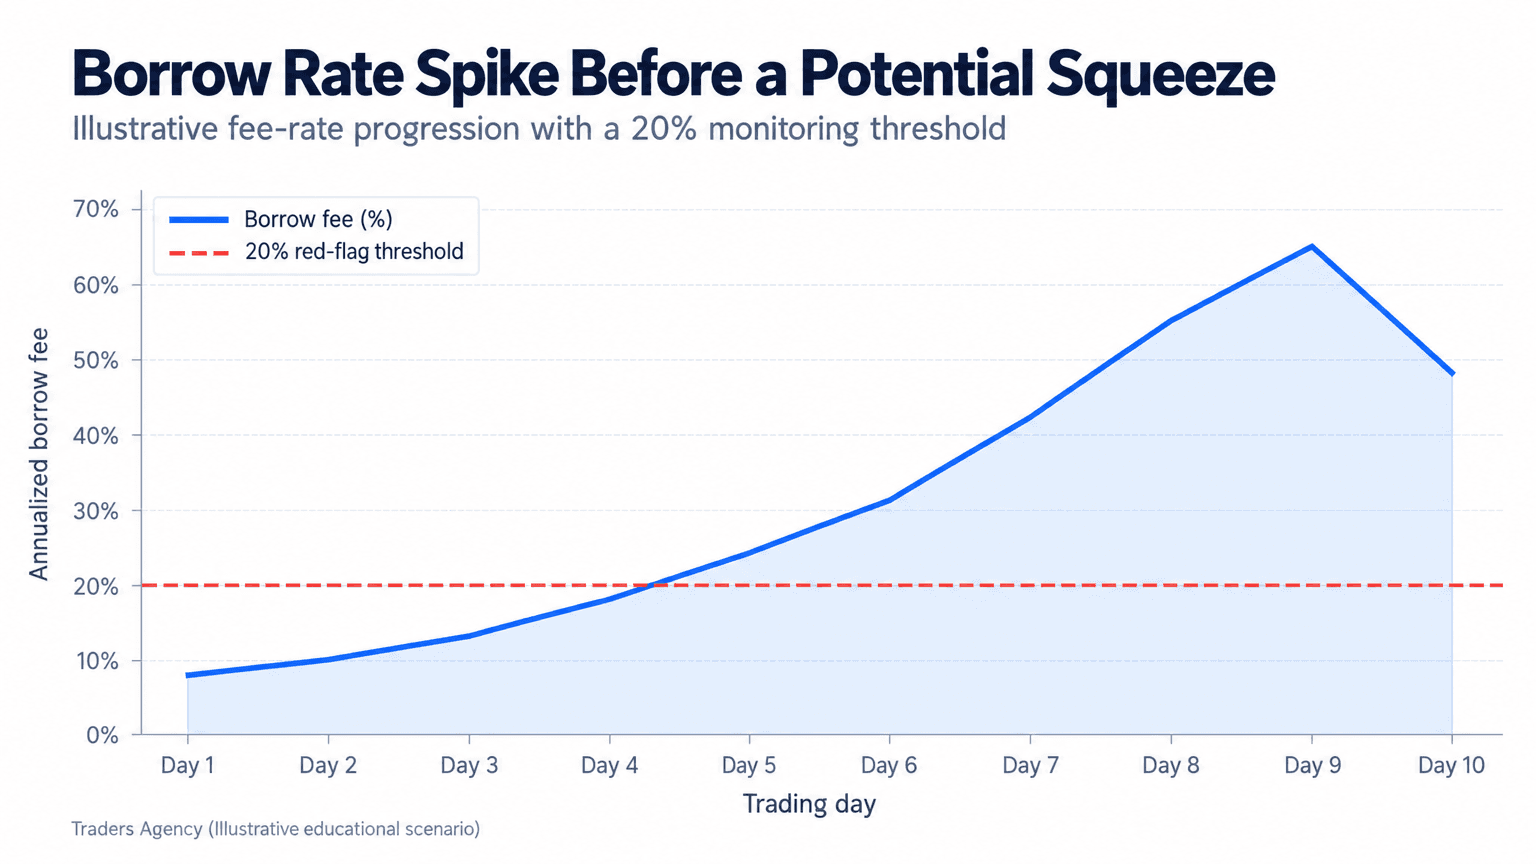
Borrow rates rise when demand to short a stock exceeds the available supply of shares to borrow, and a sharp spike in that fee often precedes a squeeze because it shows shorts are running out of room and paying a premium to stay positioned. This is the core mechanic behind borrow rates and short squeezes.
Think of the borrow rate as a rental fee. When plenty of shares are available to borrow, the fee is low, often under 1% annualized. When shares become scarce because everyone wants to short the same stock, the fee climbs because lenders can charge more for something in short supply. A fee rate crossing 20% is widely treated as a red flag that a stock has become genuinely hard to borrow, not just mildly popular with short sellers.
This matters because a high borrow rate tells you something short interest alone cannot: it tells you the cost of staying short, not just the size of the short position. A stock can have high short interest and still have a low borrow rate if there's plenty of supply. But when the fee is climbing fast while the shares available to lend are shrinking, that's a sign shorts are under real financial pressure, not just directional risk.
Key Concept: A rising borrow rate measures the cost of staying short. Rising short interest measures the size of the short position. You need both moving together to build real squeeze pressure.
Where Do Short Sellers Borrow Stock From?
Short sellers don't pull shares out of thin air. They borrow them through their broker, who in turn sources shares from institutional lenders like pension funds, mutual funds, and other large shareholders willing to lend out stock for a fee. This lending market is largely invisible to retail traders, which is exactly why we encourage tracking the fee that results from it: the borrow rate.
How Does Short-Covering Work?
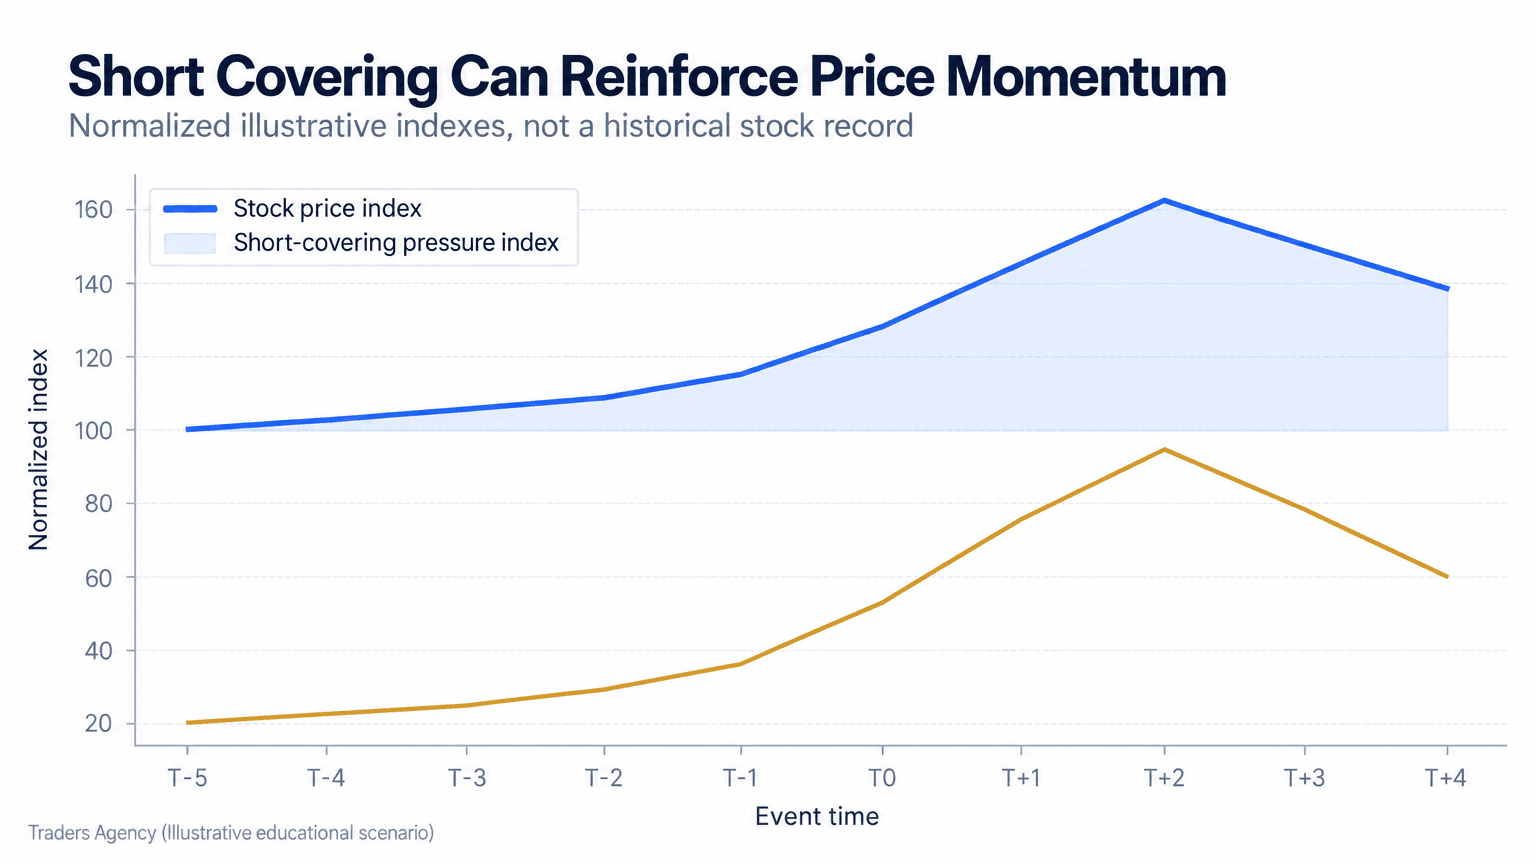
Short-covering is the act of a short seller buying back shares to close out a borrowed position, and when it happens across many traders at once under time pressure, it can create a self-reinforcing rally. That's where theory turns into real price action.
Step-by-Step: A Hypothetical Squeeze Scenario
Let's walk through an illustrative example using round numbers to show how this plays out.
- Step 1: Setup. A mid-cap stock trading at $15 has short interest of 35% of float, and the borrow rate has quietly climbed from 5% to 22% over two weeks.
- Step 2: Trigger. A positive earnings surprise or a viral social media post drives a wave of buying, pushing the stock up 12% in a single day.
- Step 3: Pressure Builds. Shorts with the highest borrow costs start covering first, since they're bleeding money daily just to hold the position.
- Step 4: Acceleration. As the price rises further, margin calls force additional shorts to cover regardless of their view on the stock's fundamentals.
- Step 5: Peak and Fade. Once most of the weak-handed short positions are closed, the artificial buying pressure disappears and the stock often gives back a significant portion of the gain.
| Scenario | What Happens | Likely Outcome |
|---|---|---|
| Most Likely | Sharp multi-day run, then covering winds down | Partial retracement of gains |
| Best Case | Early entry, run extends over days or weeks | GameStop-style extended rally |
| Worst Case | Late entry after move is already exhausted | Next move is down, not up |
Want expert trading insights delivered daily?
Join thousands of traders who rely on Traders Agency for market analysis and trade ideas.
Join Traders AgencyWhat Are the Key Indicators of a Short Squeeze?
We never rely on the borrow rate alone. We teach our members to layer several signals together because any single metric can mislead you.
- Short interest as a percentage of float: generally considered elevated above 20% of float, and genuinely high above 30%
- Days to cover: short interest divided by average daily volume; a reading above 5-7 days suggests shorts would struggle to exit quickly
- Borrow rate trend: a sharp, sustained increase matters more than the absolute level on any single day
- Shares available to borrow: a shrinking pool, shown on brokerage hard-to-borrow lists, often moves before the fee rate does
- Unusual volume and price action: squeezes rarely happen on quiet days, so look for volume well above the stock's 30-day average
How Much Short Interest Is High?
As a general guideline, short interest above 20% of float is considered elevated, and anything above 30% is widely viewed as extreme and squeeze-prone. Context matters too: a small-cap stock with low liquidity can be squeezed at lower short interest percentages than a large, heavily traded name, because it takes far less buying volume to move the price.
How Do You Read Hard-to-Borrow Data Before It Spikes?
Most retail traders never look at this data, which is exactly why it's useful. Many major brokerages publish a hard-to-borrow list that shows which stocks have limited share availability and what fee rate is currently being charged to short them.
Practical Walkthrough
Here's how we check this ourselves:
- Step 1: Find the tool. Log into the brokerage platform's market data section and locate the short stock availability or hard-to-borrow tool.
- Step 2: Pull the numbers. Search the ticker and note the fee rate and the number of shares available to borrow.
- Step 3: Track the trend. Check back daily. A fee rate climbing from single digits toward 20% or higher, paired with a shrinking share count, is the combination we watch most closely.
- Step 4: Confirm with short interest. Cross-reference with short interest data, which is typically updated twice a month through FINRA-reported figures, to see whether the short position is also large relative to float.
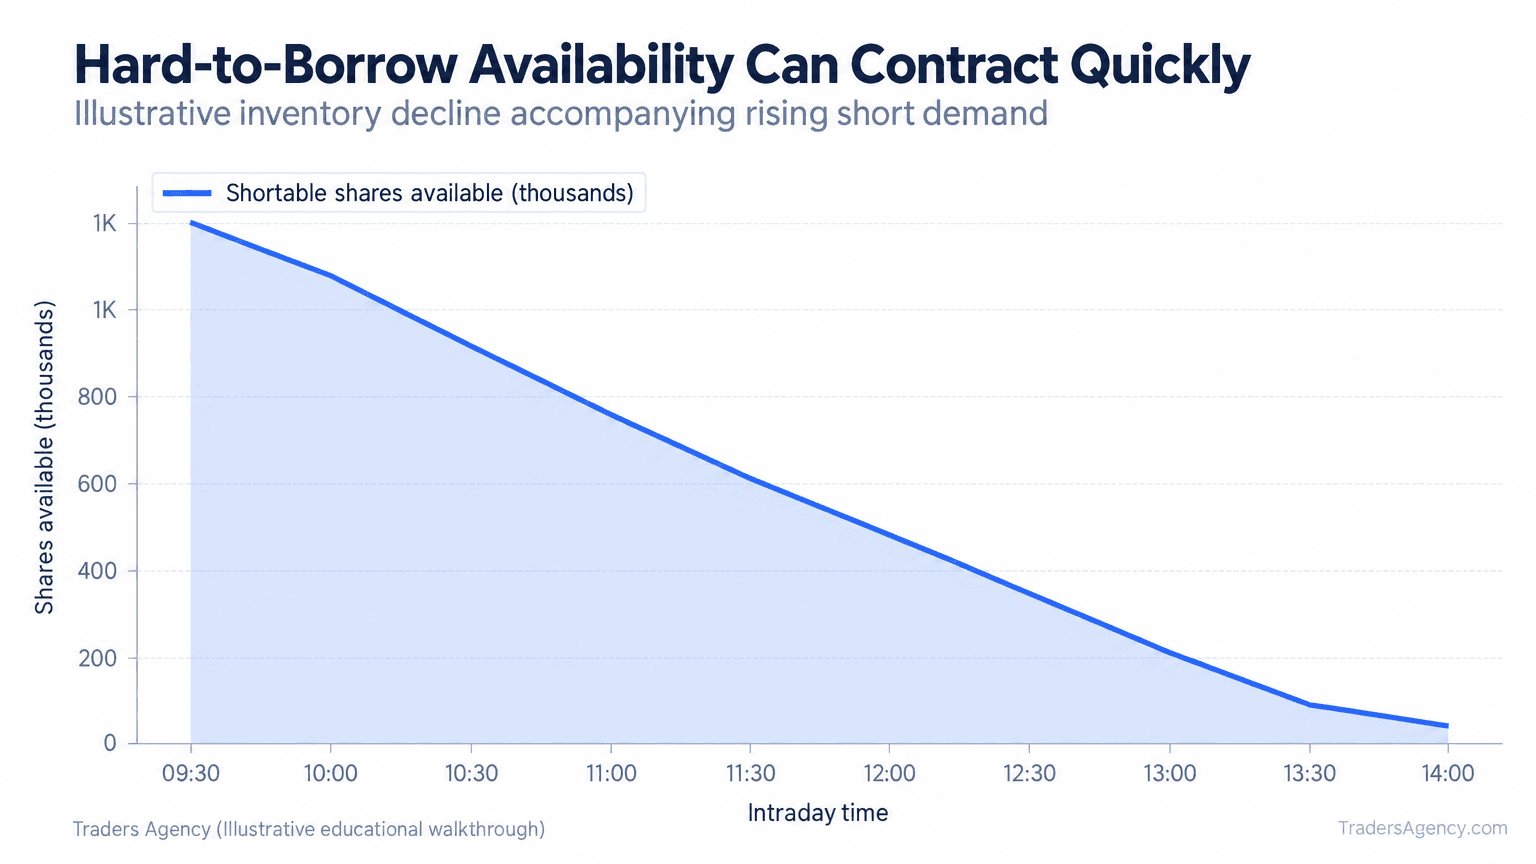
This exact pattern, dropping share availability combined with rising fees, is the kind of thing that fuels discussion whenever a borrow rate short squeeze thread gains traction on trading forums, and it's also visible (though less detailed) on many retail broker screens and third-party data overlays. The data itself is the same regardless of platform. What matters is whether you're actually checking it before the move happens, not after.
Risks of Trading During a Short Squeeze
We want to be direct about this: trading an active or anticipated squeeze is one of the riskiest things a retail trader can do, and plenty of experienced investors avoid it entirely. Even famous short sellers get burned. Warren Buffett has publicly said he avoids short selling individual stocks, citing the unlimited risk and his preference for long-term ownership. That alone reflects how unpredictable and asymmetric the risk can be on the short side.
- Unlimited loss potential for shorts, which is the mechanical reason squeezes happen in the first place
- Extreme volatility for anyone trading the long side, including sudden, sharp reversals once covering is exhausted
- Low liquidity in heavily shorted names, which can widen bid-ask spreads and make exits costly
- Borrow rate spikes that reverse quickly, sometimes without any meaningful price move, generating false signals
- Options pricing distortion, where implied volatility on heavily shorted names can make calls extremely expensive even before a squeeze materializes
Watch Out: A rising borrow rate by itself is not a buy signal. We treat it as one piece of a larger puzzle, never as a standalone trigger.
When Should You Avoid Borrow-Rate-Driven Trades?
Treating a borrow rate spike as a guaranteed signal is one of the most common mistakes we see new traders make. If short interest is modest, days-to-cover is low, and there's no unusual volume accompanying the fee increase, the spike may just reflect temporary supply and demand in the lending market with no connection to an upcoming price move.
We generally avoid these setups when the stock has very low trading volume, when the borrow rate spike isn't paired with rising short interest or declining share availability, or when there's no clear driver (earnings, news, heavy social media attention) that could trigger actual covering. We also avoid sizing these trades like normal positions. Given the volatility involved, we recommend treating squeeze-adjacent trades as a small portion of a portfolio, often in the low single digits as a percentage of total capital, with a predefined stop level set before entry rather than after the position starts moving against you.
Key Concept: The strongest squeeze setups combine three things at once: a rising borrow rate, shrinking shares available to borrow, and a real event driving unusual volume. Any one of these alone is just noise.
Want expert trading insights delivered daily?
Join thousands of traders who rely on Traders Agency for market analysis and trade ideas.
Join Traders AgencyDISCLAIMER: Traders Agency does not offer financial advice. The information provided is for educational purposes only and should not be considered financial advice. Traders Agency is not responsible for any financial losses or consequences resulting from the use of the information provided. Trading carries inherent risks and may not be suitable for all individuals. You are advised to conduct your own research and seek personalized advice before making any investment decisions, recognizing the potential risks and rewards involved.
See more from Traders Agency on Google
Make us a preferred source and our market analysis will appear more prominently in your Google Search, Top Stories, and AI results.
Add to Preferred Sources