Stock Market Blog
Daily stock market analysis, trade alerts, and trading education from Ross Givens and the Traders Agency team.
Skilled Traders Need to Get Used to This
We got more consumer confidence data this morning and despite so much doom-and-gloom talk, it came in significantly stronger than expected. Let’s see how markets have been moving.
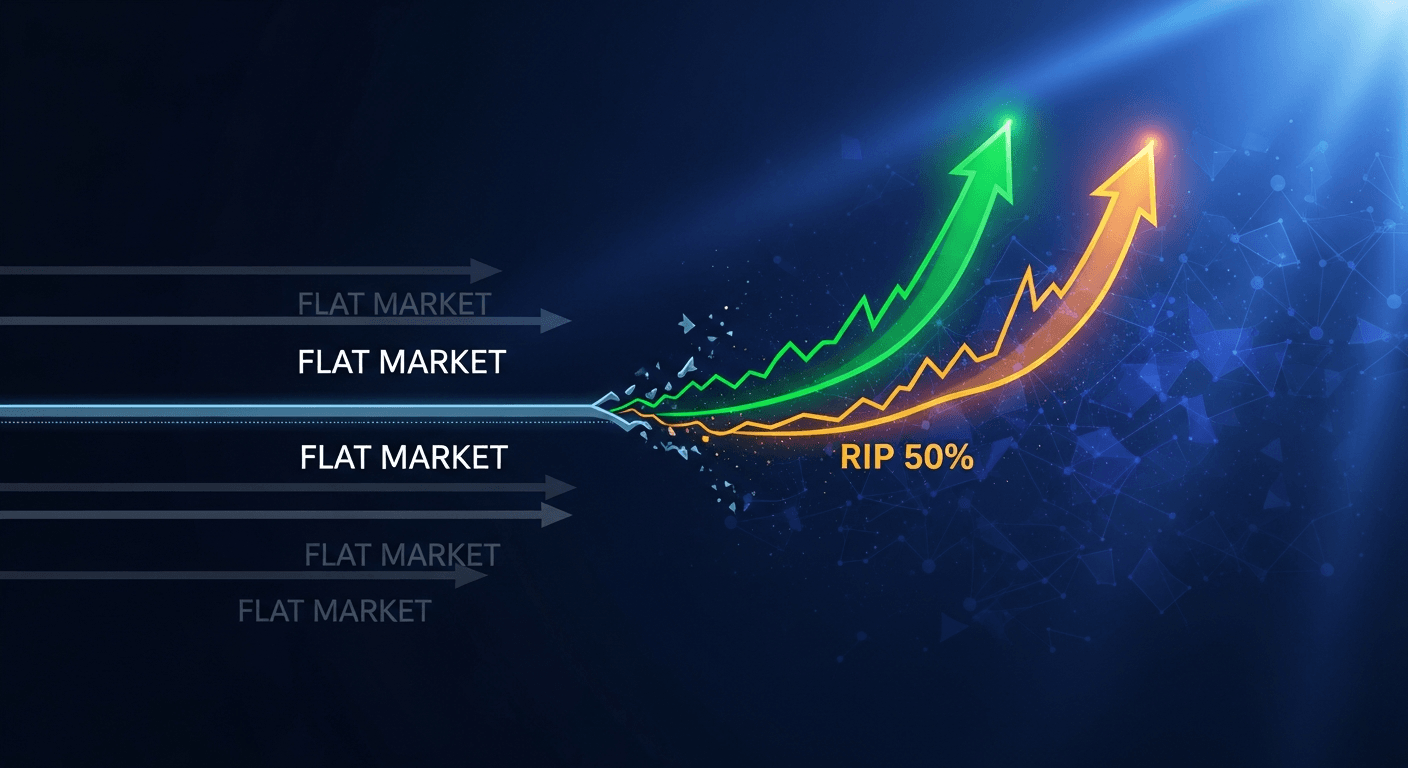
The Market Is Flat… But THESE 2 Stocks Could Rip 50%
The major indices are lying to you. Pull up the NASDAQ or S&P 500 right now. You’ll see a whole lot of nothing. Both have been stuck in a holding pattern for months – chopping around near the highs with zero real advancement.

The 2025 Trading Report They Don’t Want You to See | Congress Stock Trading
The results of the 2025 Congressional Trading Report are in. These aren’t slight outperformance numbers. They’re statistical anomalies that would get any normal citizen investigated.
You Must Understand This Before Trading
The latest data on the Fed’s preferred inflation gauge – the PCE index – came out this morning. The annual numbers came in at 3% annually – in line with expectations – but a clear sign that inflation is still trending very much above target.
How to Beat the Market Without Picking Stocks
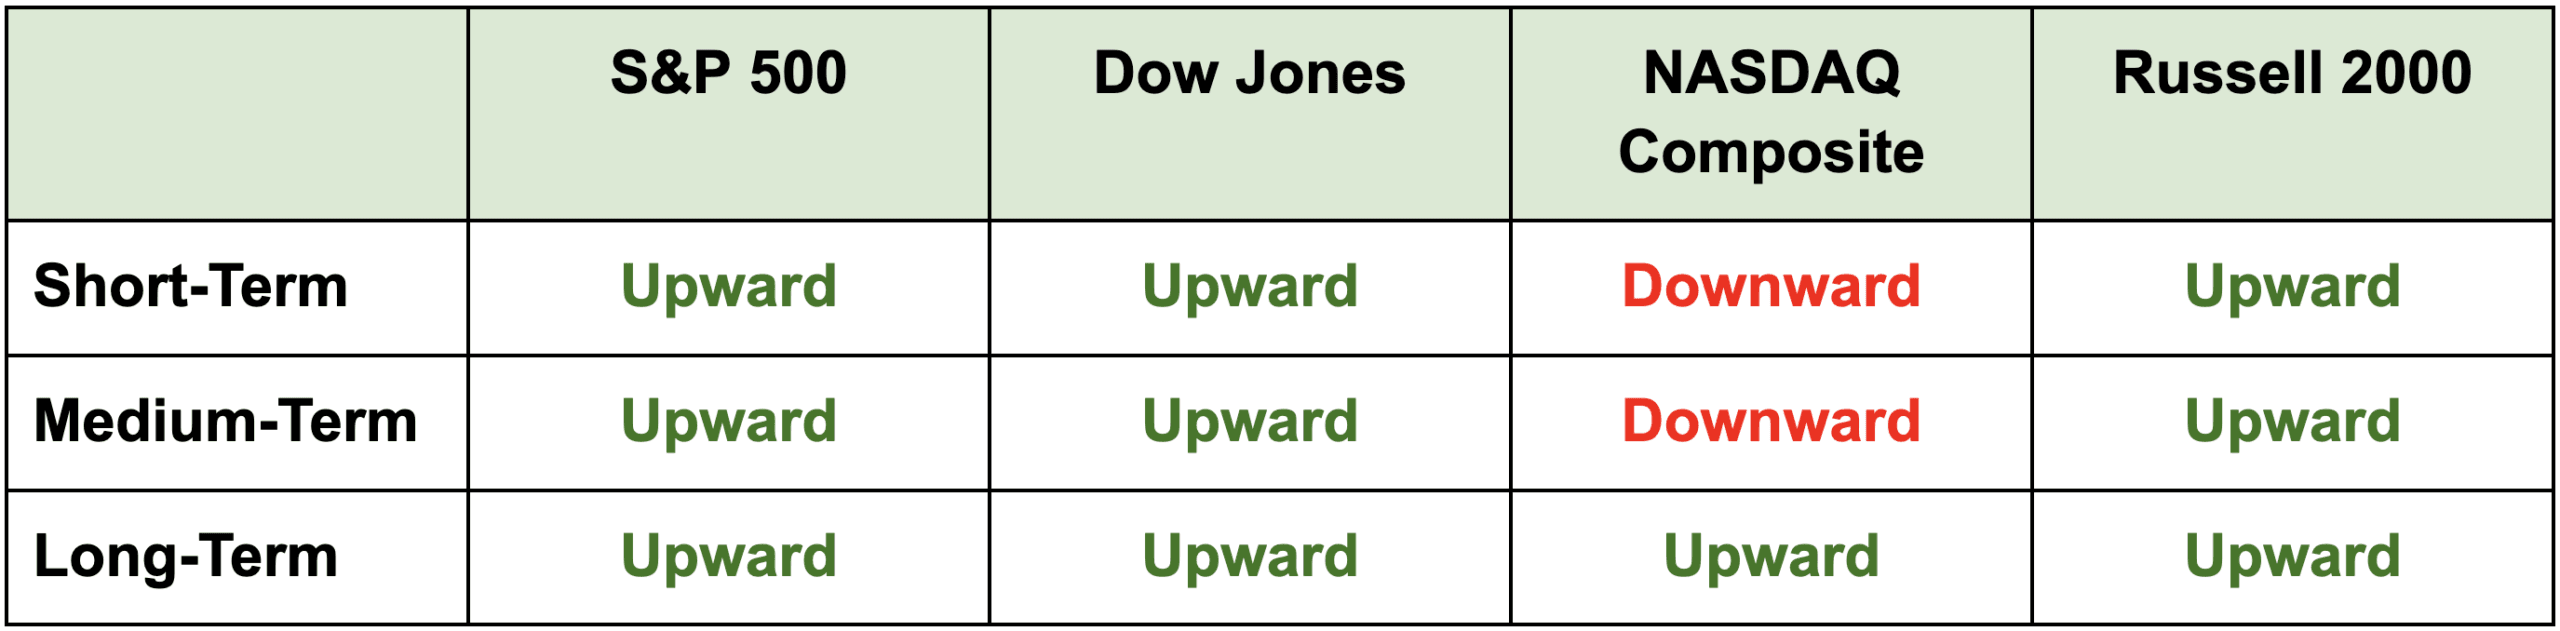
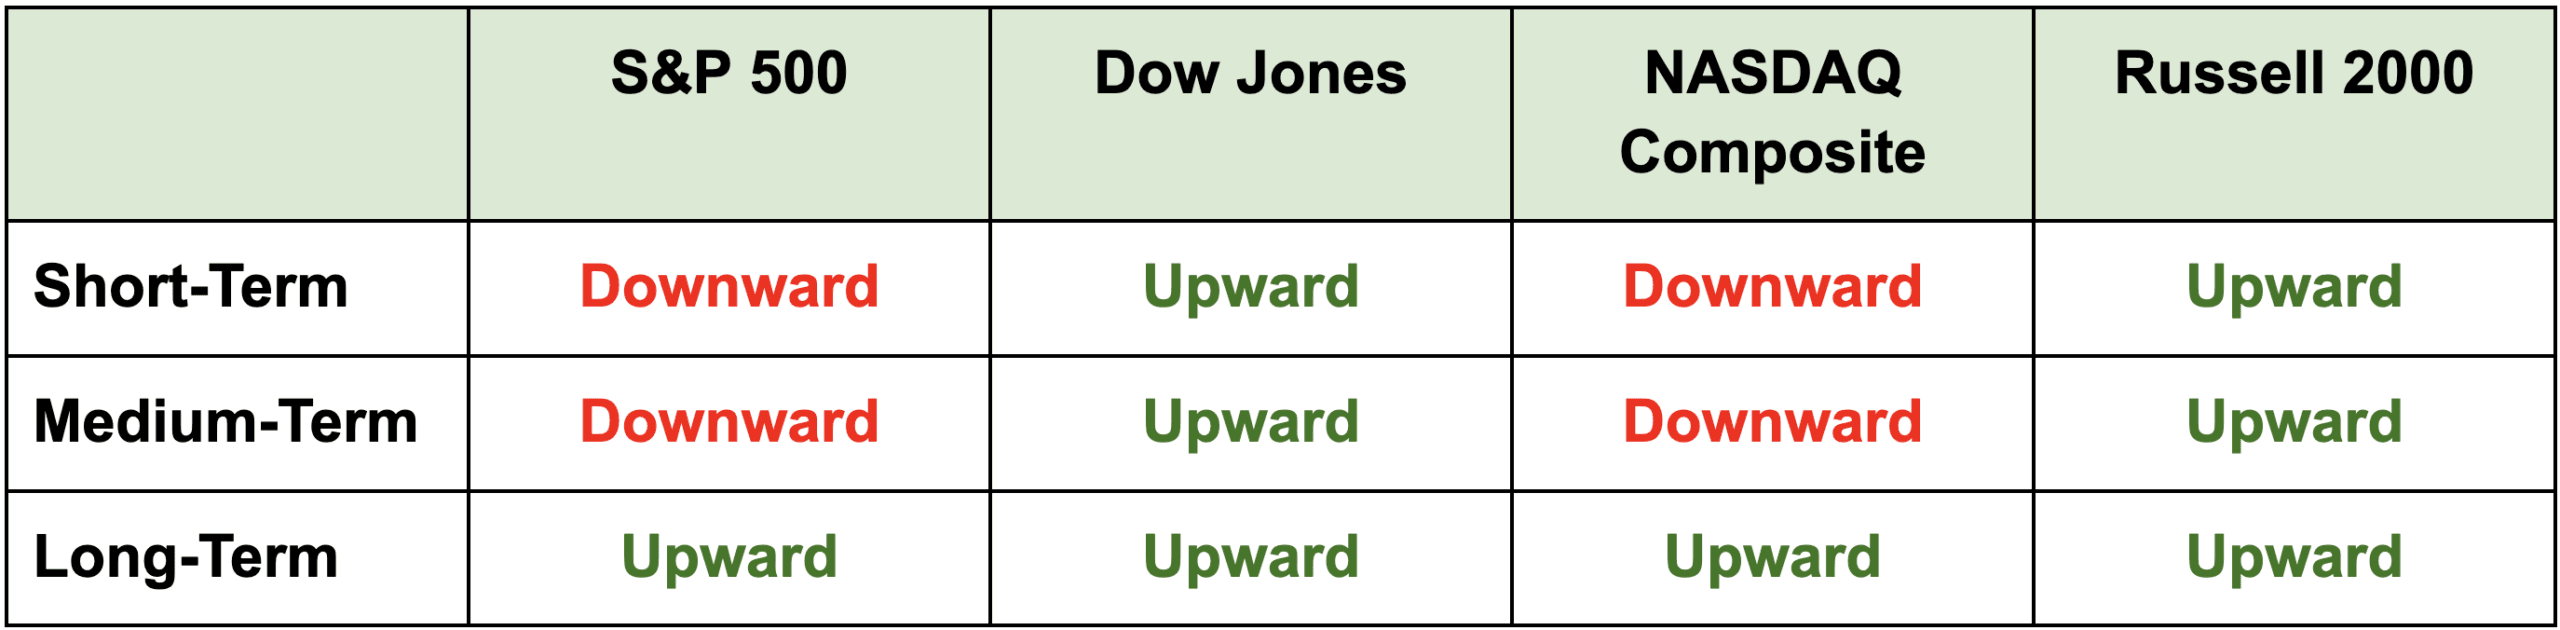
It’s the last week of what has been a very choppy, sideways February for the broader markets. I don’t expect that to change this week. But when we “slice” the market a bit more, a different picture emerges.
Who Wins This Battle?
It’s the last week of what has been a very choppy, sideways February for the broader markets. I don’t expect that to change this week. But when we “slice” the market a bit more, a different picture emerges.
This Won’t Help You Make Money
The latest data on the Fed’s preferred inflation gauge – the PCE index – came out this morning. The annual numbers came in at 3% annually – in line with expectations – but a clear sign that inflation is still trending very much above target.
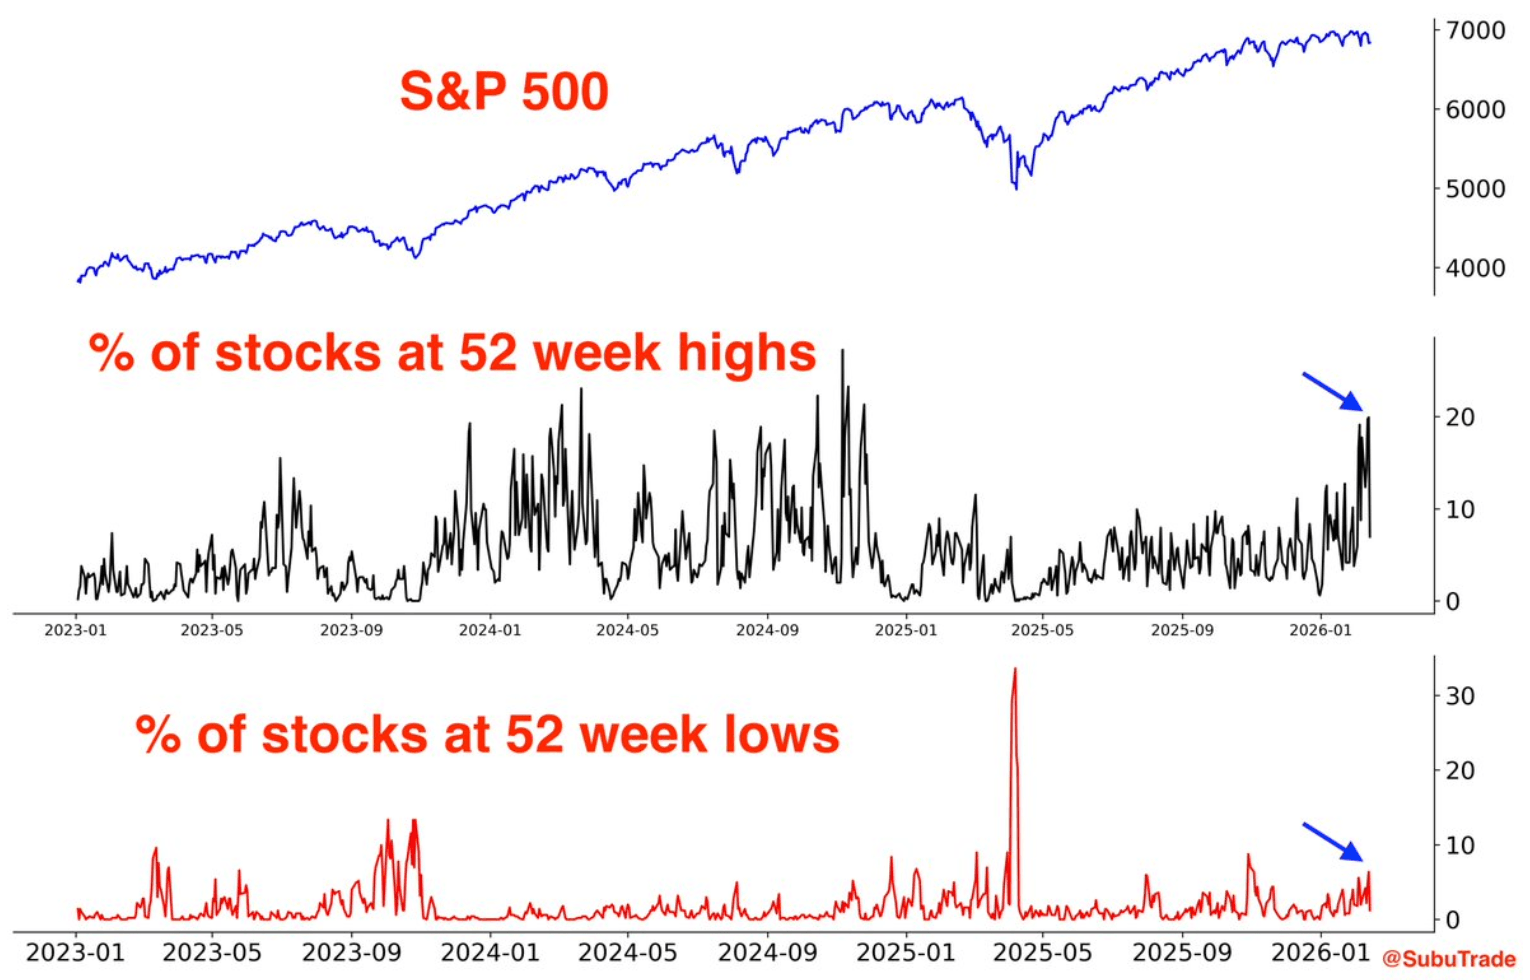
The “Blowup Indicator” Just Triggered… But I’m Buying Instead
A chart going viral on Finance Twitter is flashing what many are calling a MAJOR warning for stocks. But ’m not panicking. In fact, I believe this signal is different. And I’ll show you why this could actually be a bullish setup for the stock market in 2026.
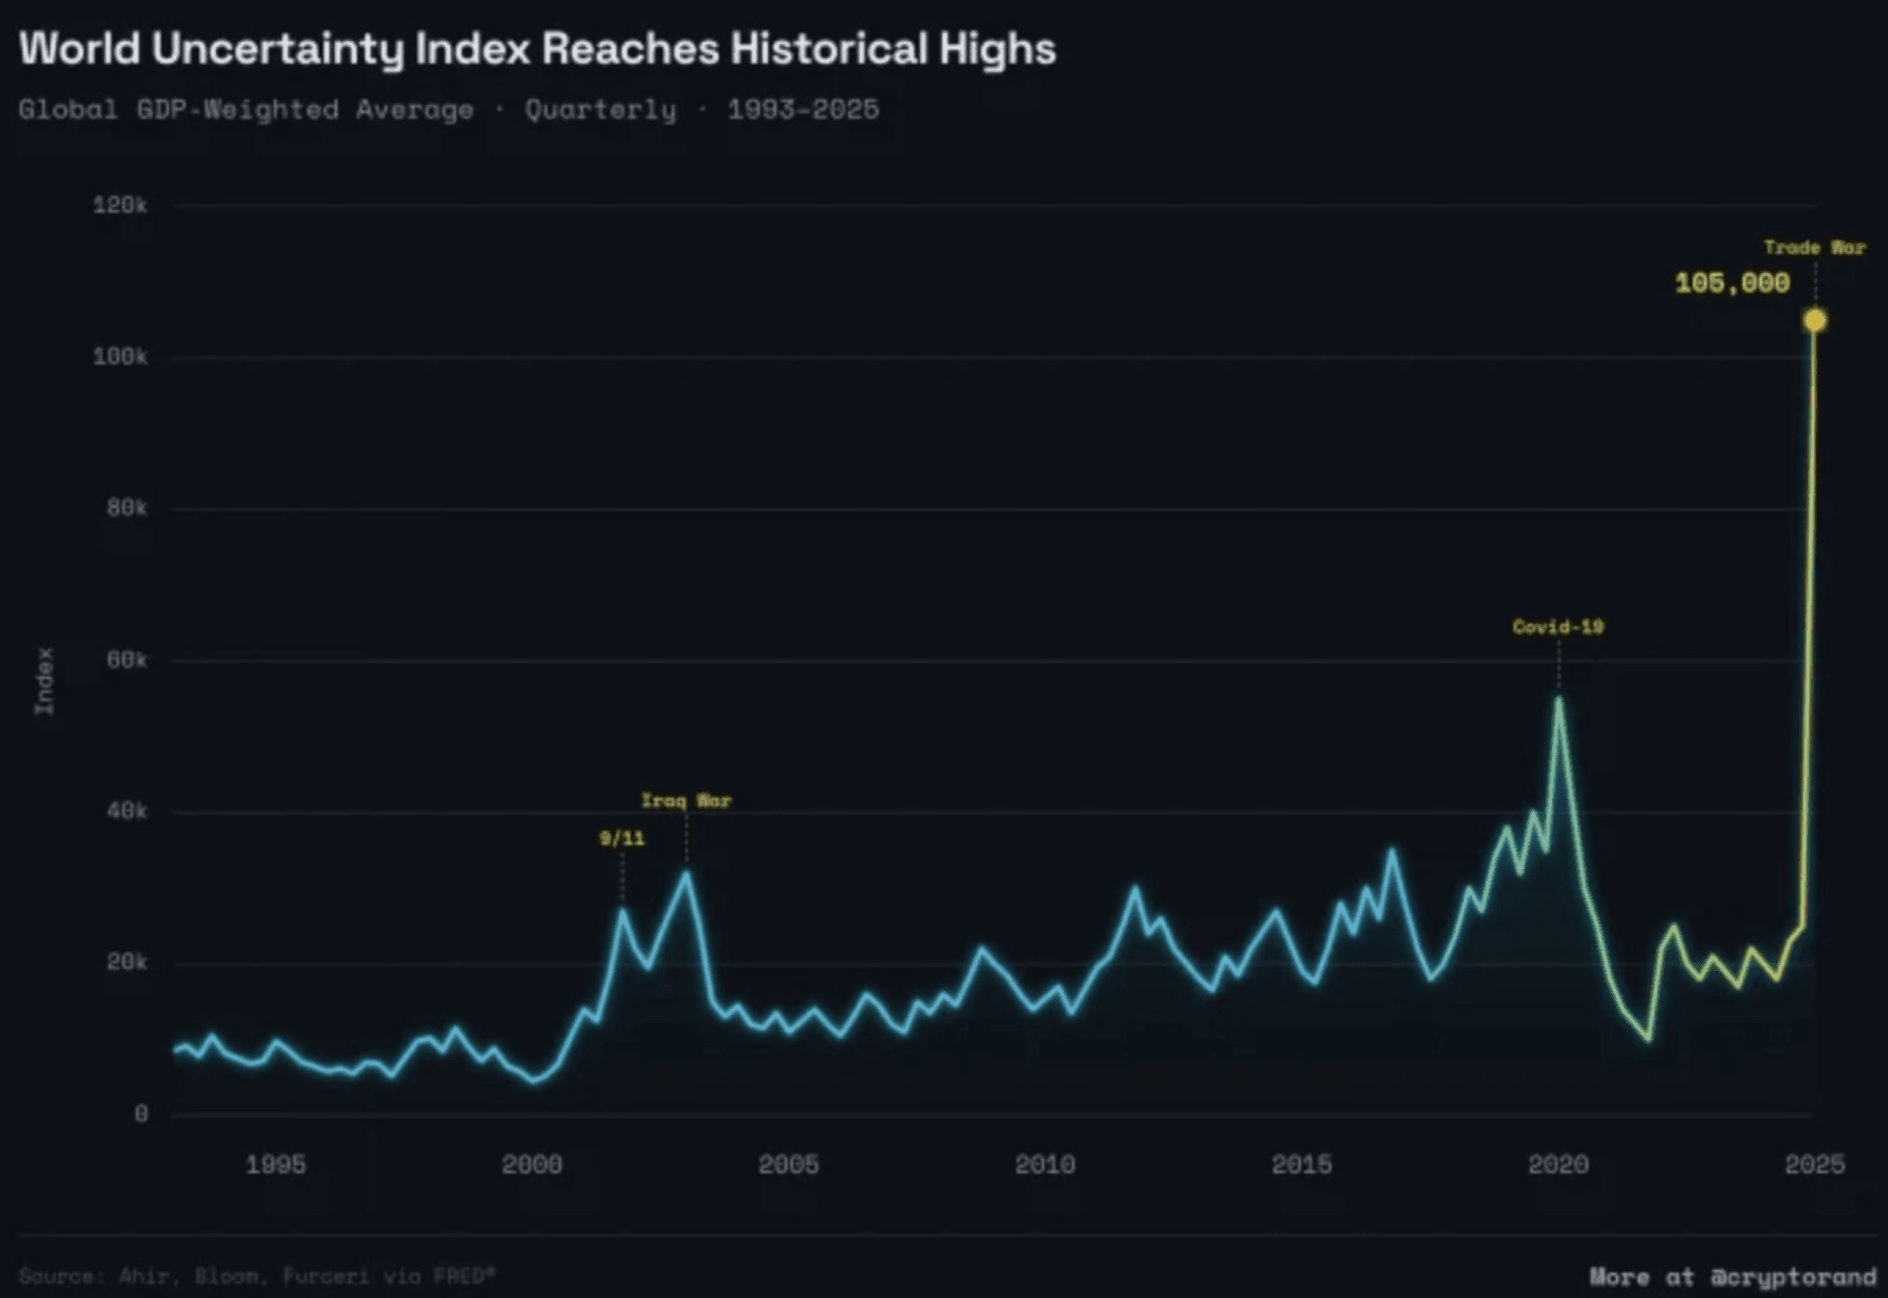
Maximum Uncertainty (and How to Play It)
The market today isn’t the same as the AI-driven bull market of 2023–2024 (or even 2025). As I’ve been saying, we’re seeing a massive rotation in a “dispersed” market. To top all that off – as today’s chart shows – uncertainty is also at all-time highs.
There’s No Opportunity Without This
Nothing major on the economic front today. However, the minutes of the Fed’s latest monetary policy meeting will be released in a couple hours…
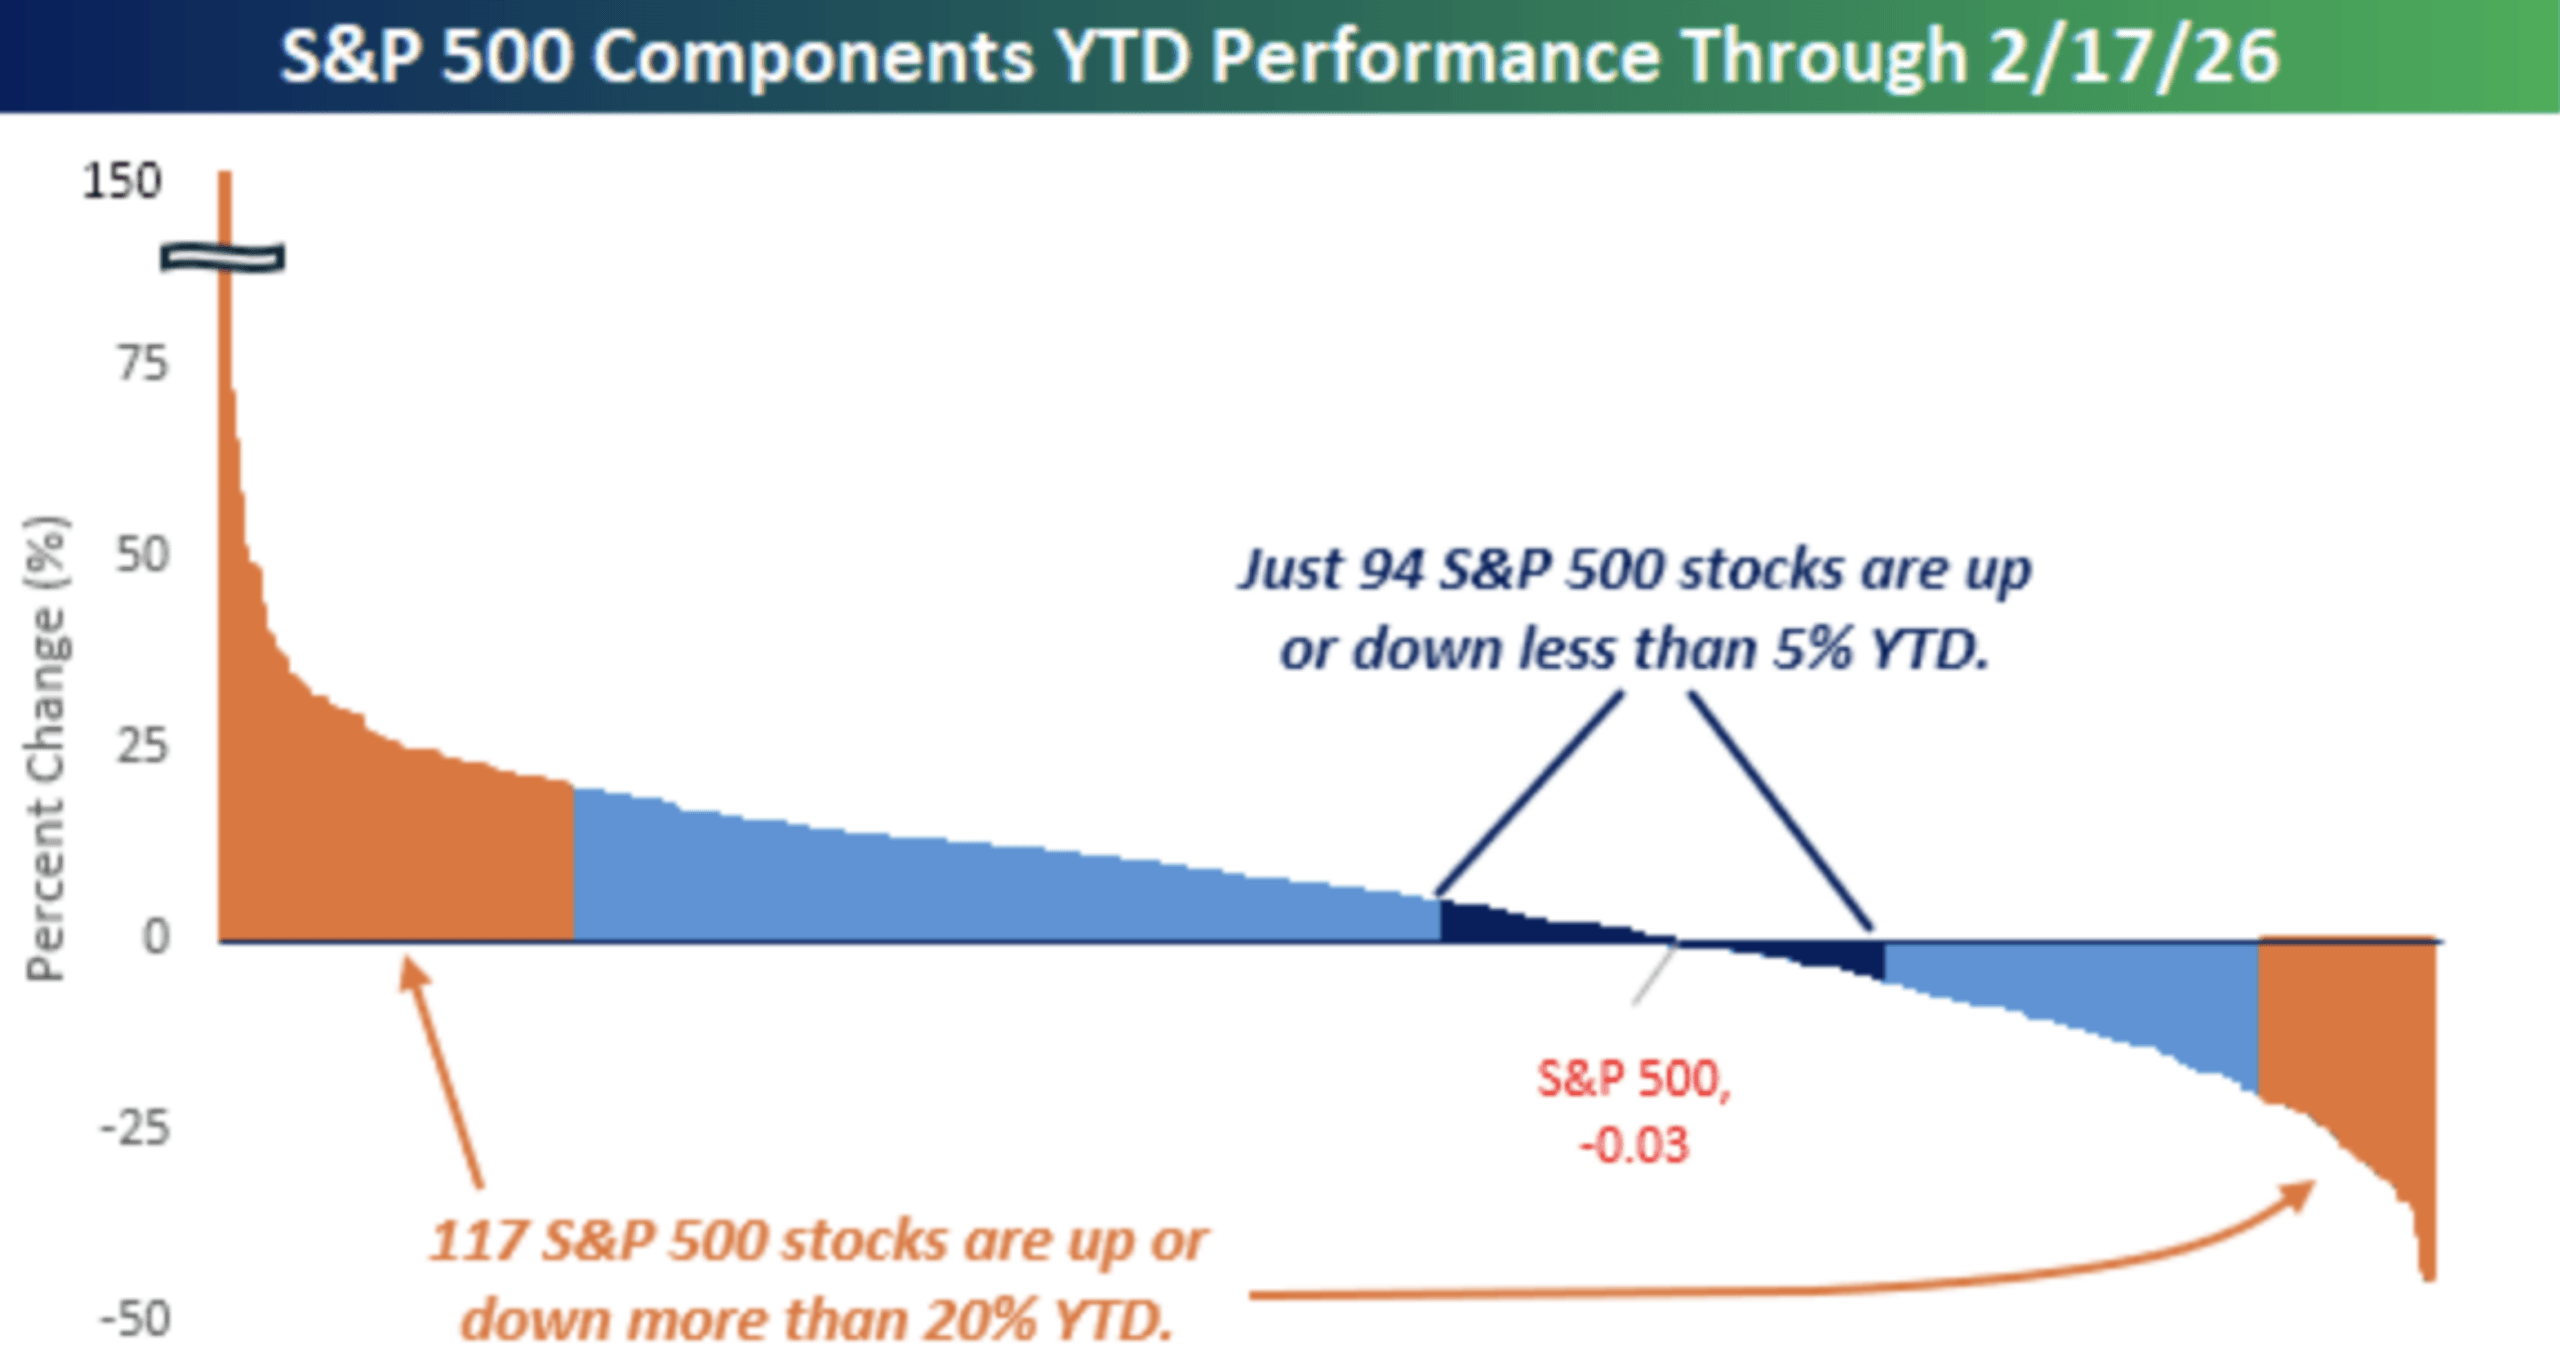
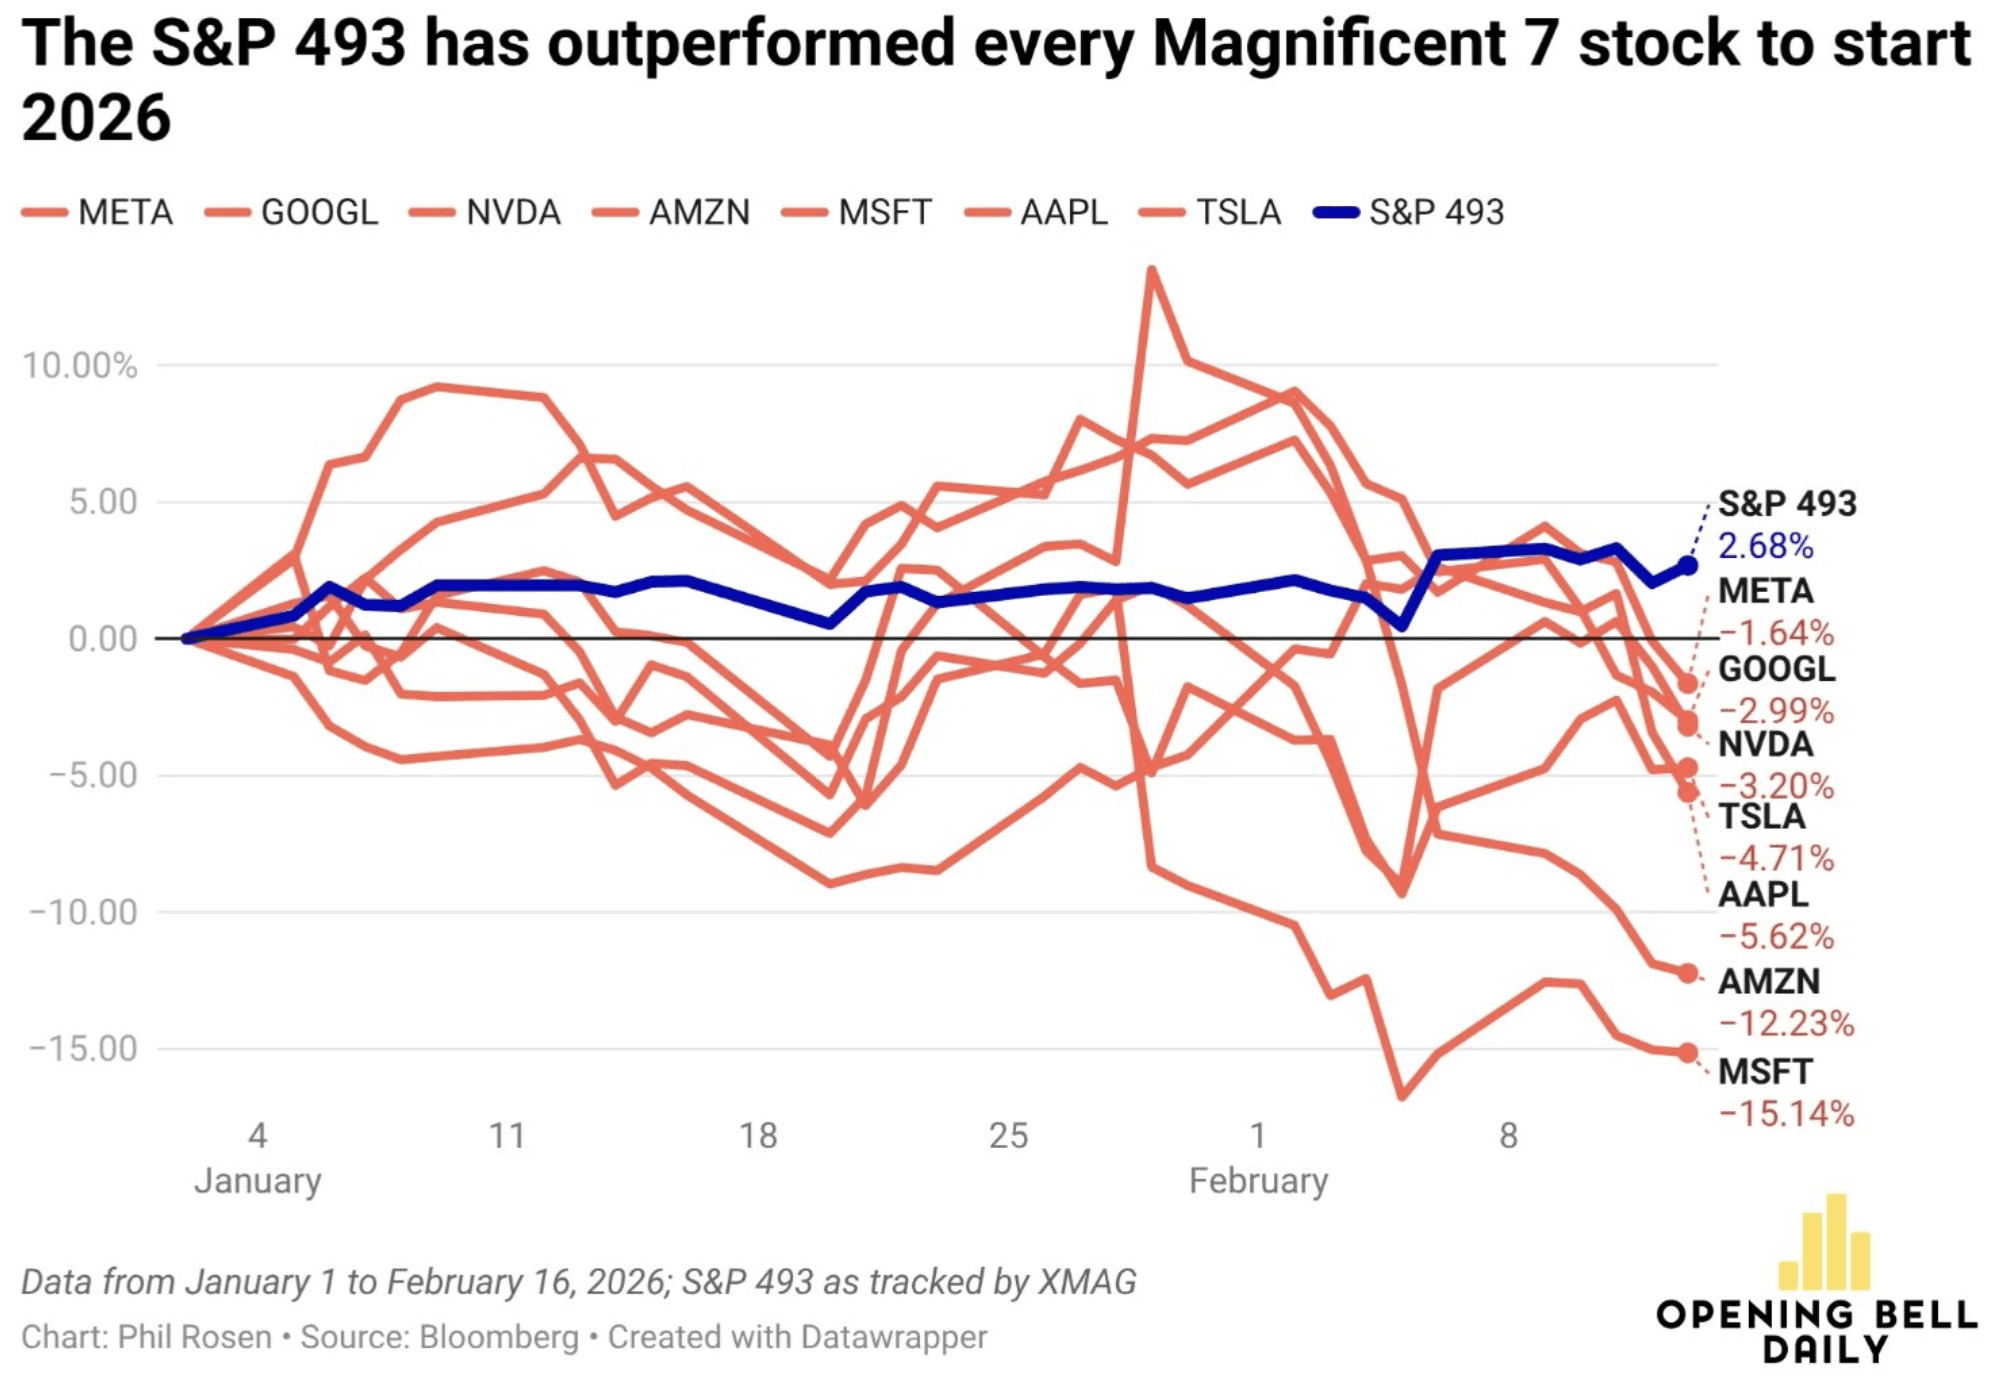
Big Swings in this “Dispersed” Market
Yesterday I talked about the dispersion we’re seeing in the markets, about how we’re seeing a sharp rise in BOTH winners and losers. Today’s chart shows just how stark that theme really is.

This Metal Is Set to Explode (Not Gold or Silver)
I’m going to show you exactly why industrial metals are outshining gold and silver—and how you can position yourself before the rest of Wall Street wakes up to what’s happening.
Stop watching.
Start winning.
50,000+ traders get our daily brief before the market opens.
You're subscribed!
Check your inbox.
Free. No spam. Unsubscribe anytime.
