Stock Market Blog
Daily stock market analysis, trade alerts, and trading education from Ross Givens and the Traders Agency team.

Barchart Review
Barchart review verdict: strong pick for futures, commodities, and options flow. See who benefits most from free access vs Premier subscription.

Why You MUST be a Market Timer in Q3
The hottest trade in the market may be changing character. And when momentum starts to crack, late buyers can get trapped fast.

Destructive Trading “Gap” You Must Eliminate
There is a powerful trading edge that 99% of traders will never be able to achieve. And the kicker is – it has nothing to do with market knowledge.
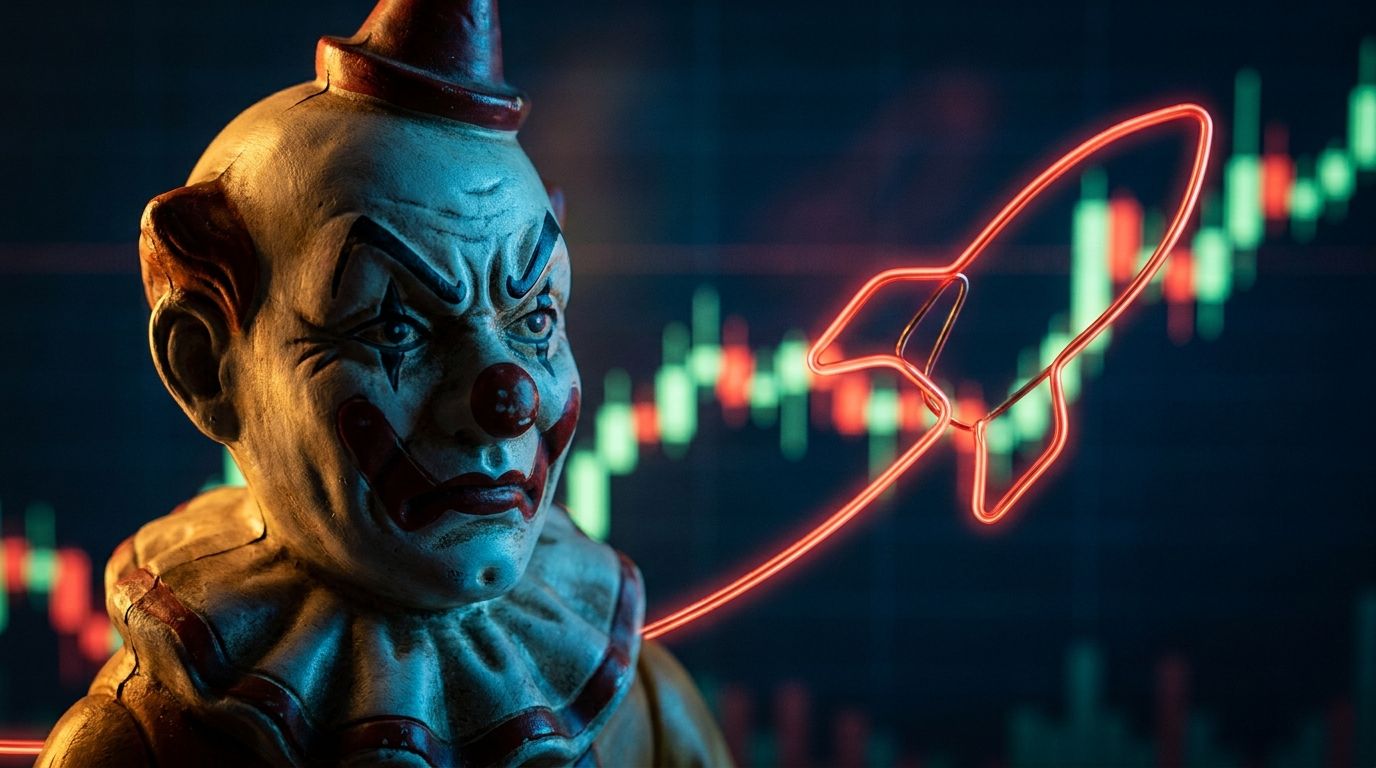
The Next GameStop Could Be This $13 Stock
The next GameStop meme stock may already be forming. Jack in the Box has tiny float, high short interest, and WallStreetBets attention — the exact GME setu

Q3 Volatility Spike Incoming?
The hottest trade in the market may be changing character. And when momentum starts to crack, late buyers can get trapped fast.

Market Chameleon Review
Market Chameleon review: is it worth it for options traders? We break down implied volatility tools, earnings analytics, and pricing so you can decide.

2 Types of Dangerous Market Headlines
There is a powerful trading edge that 99% of traders will never be able to achieve. And the kicker is – it has nothing to do with market knowledge.

Forget Oil... These 3 Shipping Stocks Are PRINTING Money
Oil tanker stocks are quietly minting cash as VLCC day rates hit $470K/day — triple last month's levels. Here's why falling oil prices mean rising tanker p

Is the Semiconductor Trade Over? (What to do Instead)
The hottest trade in the market may be changing character. And when momentum starts to crack, late buyers can get trapped fast.

The Game Beneath the Market
There is a powerful trading edge that 99% of traders will never be able to achieve. And the kicker is – it has nothing to do with market knowledge.
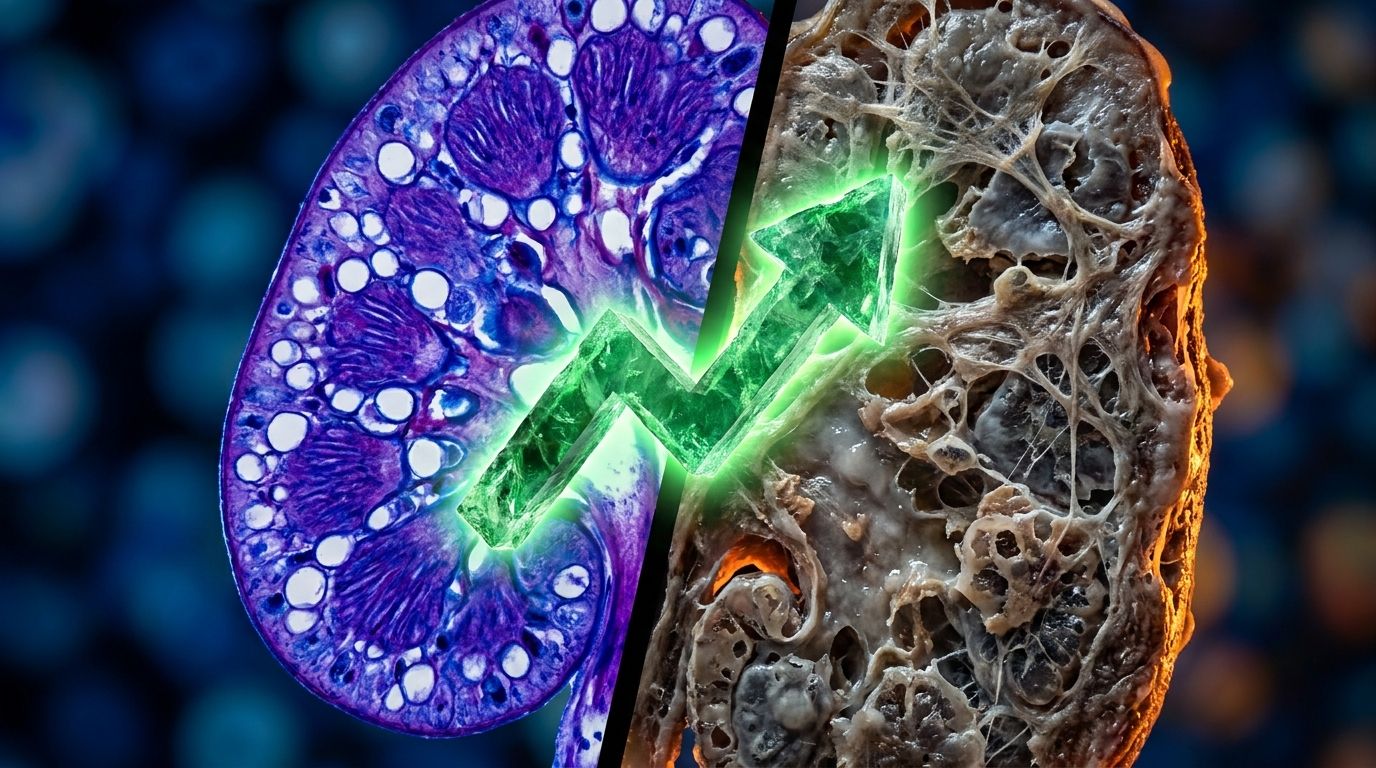
The FDA Decides July 7... Wall Street Thinks This $35 Stock Doubles
Vera Therapeutics stock faces an FDA decision July 7. Phase 3 crushed expectations with 46% kidney protein reduction. Wall Street targets $83.50 on this $3

Will the Fed Crush the Stock Market?
The SpaceX IPO is going LIVE today. What’s going to happen next – and does the massive hype mark the “top” for the market? Find out inside.
Stop watching.
Start winning.
50,000+ traders get our daily brief before the market opens.
You're subscribed!
Check your inbox.
Free. No spam. Unsubscribe anytime.
