

Hey, Ross here:
Semiconductor stocks got crushed yesterday. And they dragged plenty of the market down with them.
Let’s be real – it was an ugly day to own stocks.
But before you write off next week, take a look at what was going on behind that selling.
Chart of the Day
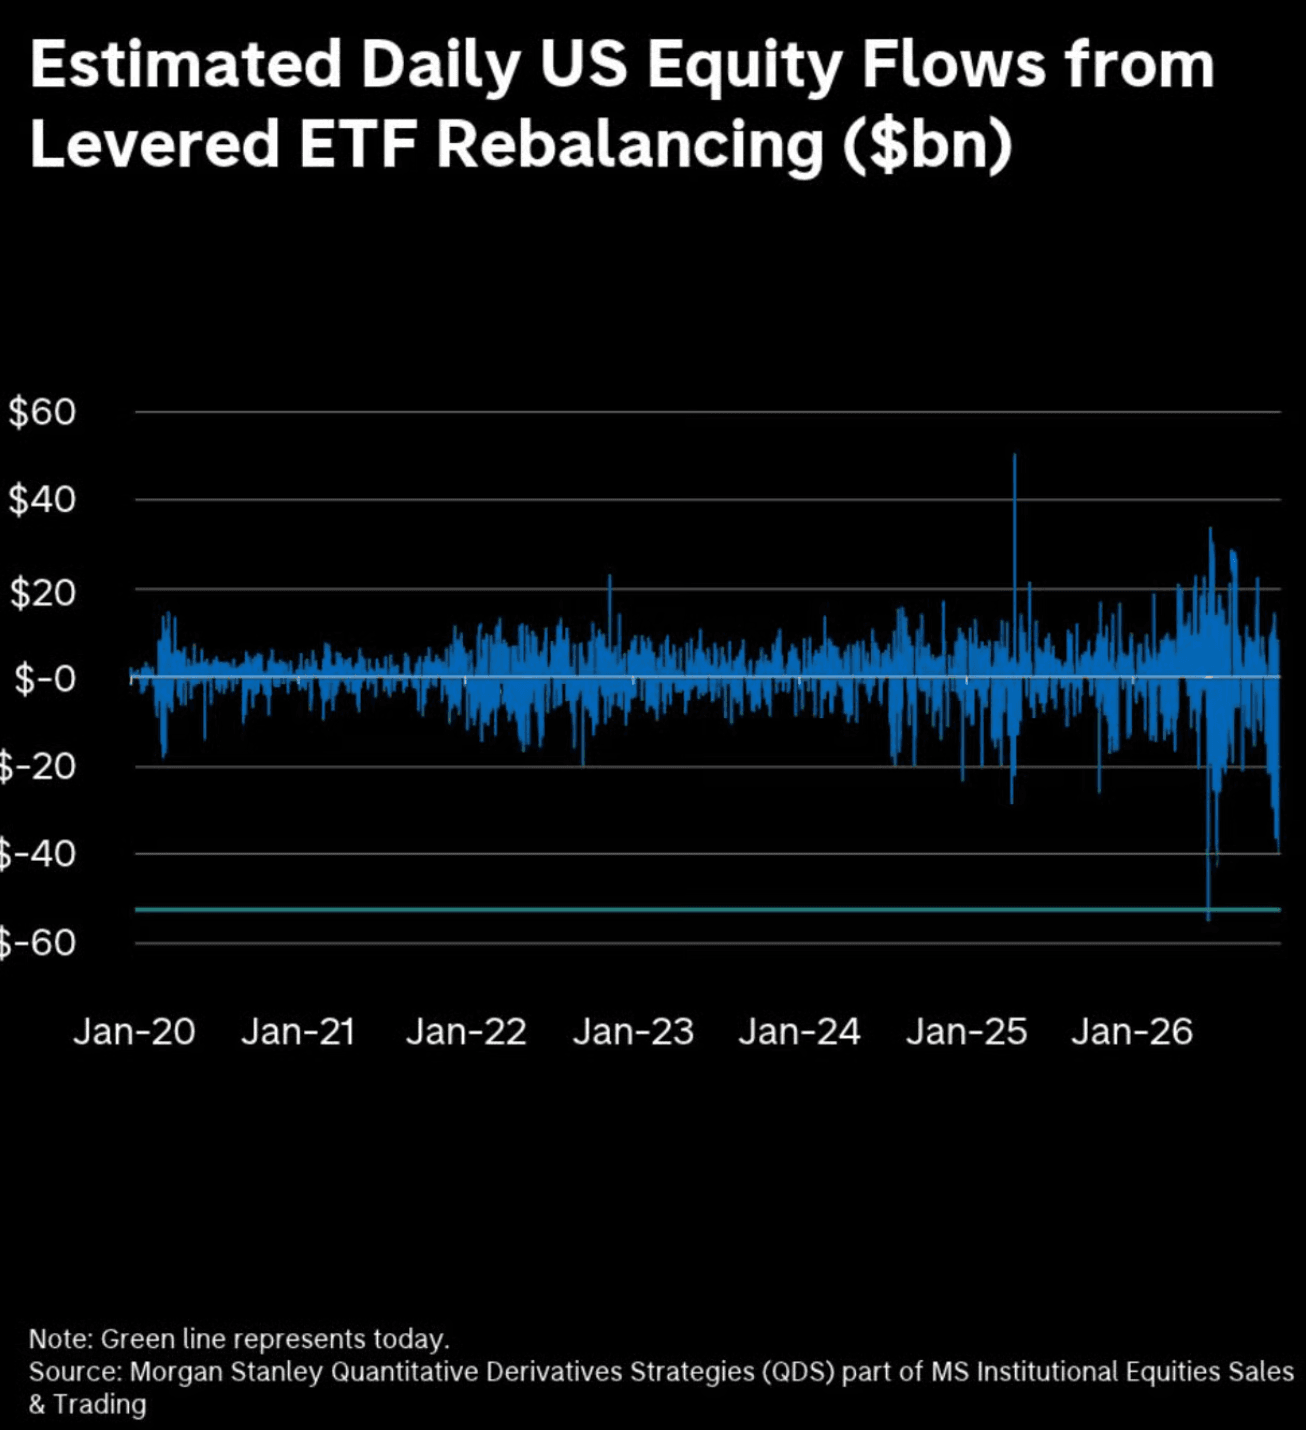
This chart tracks estimated buying and selling by leveraged stock ETFs – funds built to multiply daily market moves.
Bars below zero show selling. The green line marks Morgan Stanley’s estimate for Thursday.
At 1 p.m. yesterday, Morgan Stanley estimated that leveraged ETFs were on track to sell $52 billion of U.S. stock exposure – including $21 billion in semis.
But the market kept falling after that.
As prices fall, these funds have to cut their bets further.
So the selling pressure was likely even greater than that $52 billion estimate by the close.
Yet even after that beating, look at how many stocks were still holding above their recent averages.
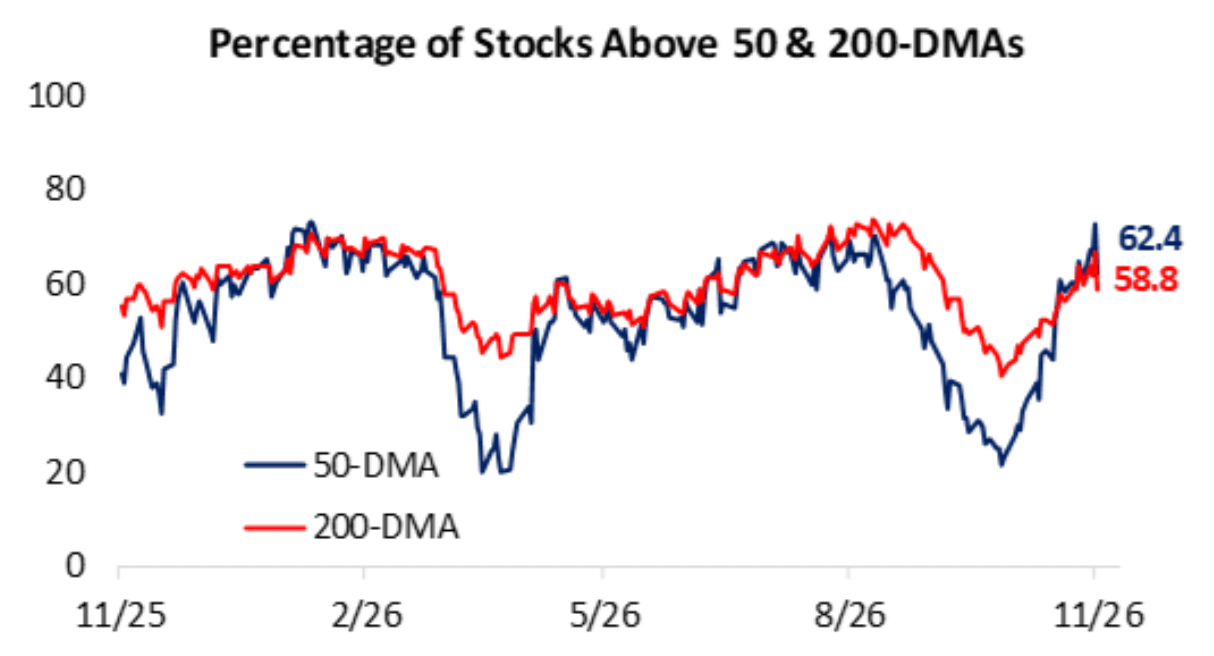
The blue line shows the percentage of S&P 500 stocks above their 50-day moving average – a gauge of their medium-term direction.
After Thursday’s selloff, that figure still stood at 62.4%.
The red line shows the percentage of S&P 500 stocks above their 200-day average – a gauge of their long-term direction.
That reading was 58.8%.
Given yesterday’s bloodbath, that’s surprisingly solid.
And that leads to the insight below.
Insight of the Day
Forced selling can make a bad market look even worse.
A forced seller doesn’t care that a stock has already been hammered.
If the fund’s rules say cut the position, it cuts the position. Even at a lousy price.
Now put billions of dollars behind those orders.
The selling drives prices lower, which can trigger still more selling from funds that follow market trends.
This is known as a liquidation cascade – a self-reinforcing cycle of forced selling…
And the data above tells me we saw a lot of that yesterday.
Now, I’m not saying there aren’t real problems with the AI trade at the moment.
But you can have real problems in tech AND selling that feeds on itself.
Both can hit the market at once.
The reason I’m not writing off this market is that forced selling can run its course.
Once those funds finish cutting their bets, that pressure can ease.
Companies don’t have to fix every problem overnight for stocks to get some breathing room.
That is NOT a promise of a green week ahead.
More forced selling could still be coming. I’m not calling a bottom in a market swinging this hard.
I’ll be watching the stocks still above their 50-day averages.
If they start breaking down in large numbers, the selloff is spreading and I’ll get more defensive.
But if they hold up while the selling burns itself out, I want them on my watchlist.
Until then, I’m sticking to my exits.
I won’t hang on to a broken trade just because I think the selling has gone too far.
And I won’t throw out a strong stock just because semis had a brutal day.
I advise you to do the same.
Have a good weekend.
Embrace the surge,

Ross Givens
See more from Traders Agency on Google
Make us a preferred source and our market analysis will appear more prominently in your Google Search, Top Stories, and AI results.
Add to Preferred Sources