
Hey, Ross here:
Two readings from the same market are telling very different stories.
Put them side by side, and you can see why this has been such a frustrating stretch for traders.
Chart of the Day
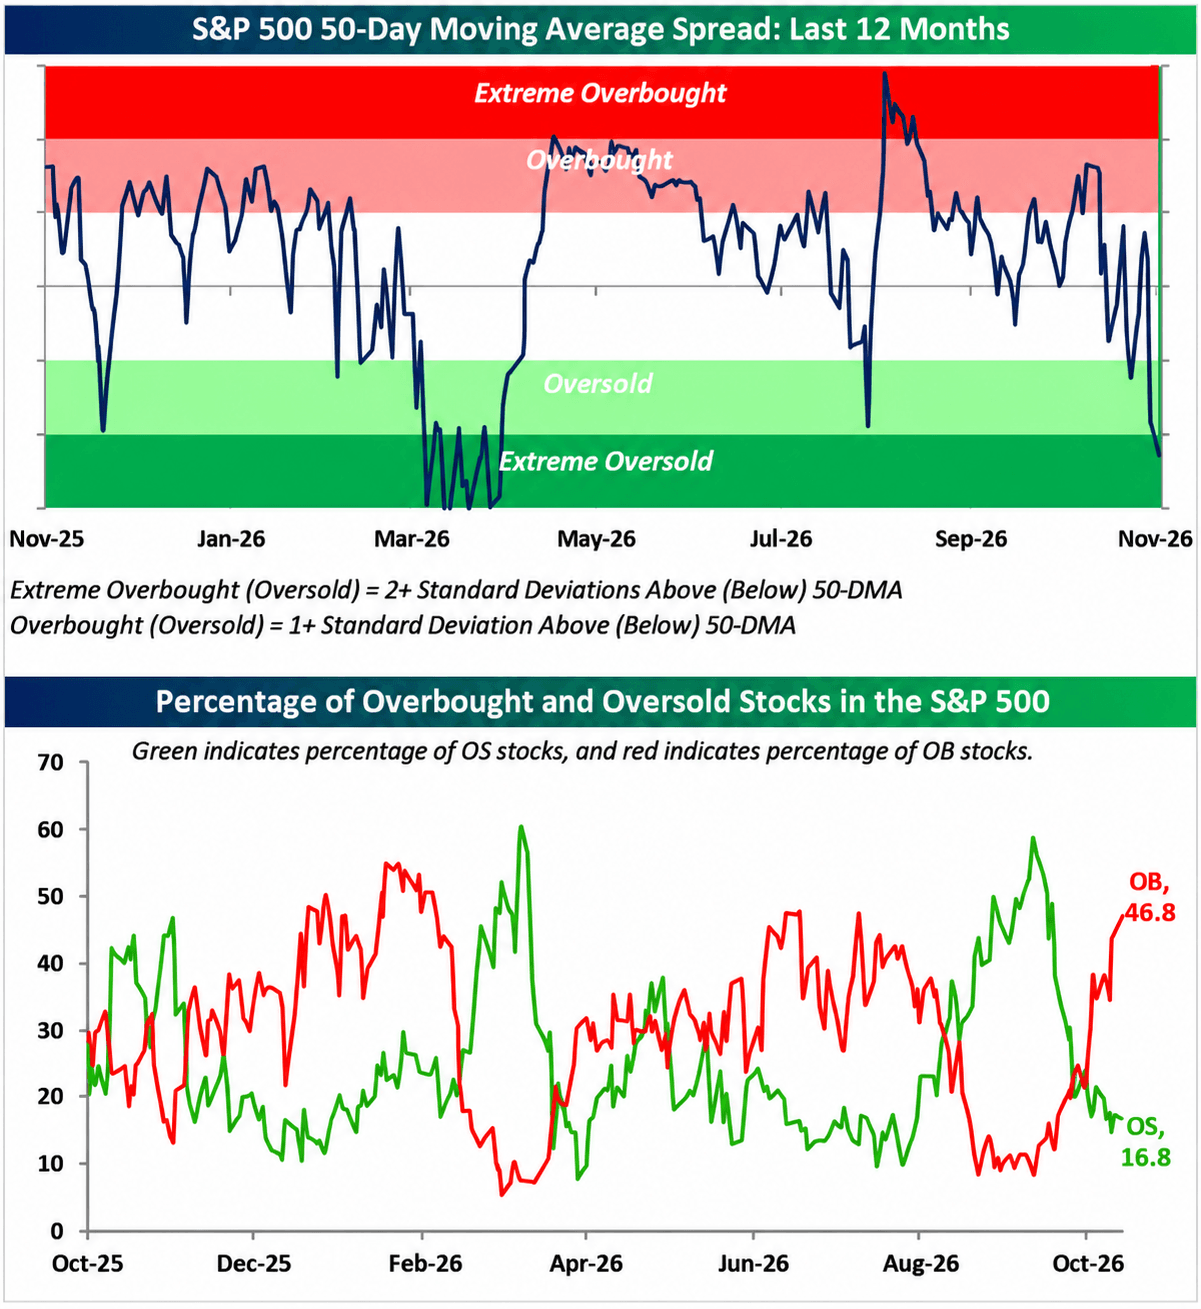
These two charts compare the S&P 500 with the stocks inside it.
In the top chart, the blue line shows how far the index is from its average price over the past 50 trading days.
It has dropped into the dark green “extreme oversold” zone. That means it’s trading unusually far below that average.
Now look at the bottom chart.
The red line shows the share of stocks that are overbought – trading unusually far above their own 50-day averages.
That’s 46.8%, or nearly half the index.
The green line shows the oversold stocks. They account for just 16.8%.
How can the index be deeply oversold when so many of its stocks are doing the opposite?
Because the biggest companies have far more weight.
Heavy selling in those names can pull the index down while hundreds of other stocks hold up or rise.
So before you treat this selloff as a chance to buy, there’s a distinction you need to make.
Insight of the Day
An oversold market doesn’t mean your stock is cheap.
“Oversold” describes where a price sits compared with its recent trend.
It doesn’t tell you what the business is worth.
And an oversold reading for the S&P tells you even less about a stock that has been climbing while the index falls.
You could buy that stock thinking you’re getting in after a selloff…
When you’re actually chasing a rally.
Even if the S&P rebounds, your stock could lag as buyers move back into the beaten-down giants.
Market-wide readings are useful for getting the broader context.
But I never use them to justify an individual trade.
The company needs its own reason to move higher from the price I’m paying.
And one of the strongest reasons to dig deeper is when someone who knows that business inside out suddenly puts millions of their own dollars into it.
Just like when one longtime CEO recently bought $3 million of her company’s stock in her first-ever open-market purchase…
After more than a decade at the company.
She wasn’t buying “the market.” She was committing her own money to the business she runs.
Following insider signals like these has helped us identify stock moves of 771% in two months, 157% in two weeks, and even 321% in two days.
If you missed yesterday’s session, I’m going LIVE again in a few hours this morning at 11 a.m. Eastern for a special encore session.
I’ll walk you through how you can start following high-level executives like her to huge setups 99% of traders will miss…
And reveal details of several stocks insiders are scooping up right now.
It’s free to attend, but seating is limited.
Click here to lock in your free seat for this morning’s encore if you haven’t yet.
I’ll see you at 11 a.m. ET.
P.S. If you’re planning to attend on a mobile device, make sure you download the presentation app now so you don’t miss anything when it starts. See you there.
iOS: apps.apple.com/us/app/goto/id1465614785
Android: play.google.com/store/search?q=goto&c=apps
Customer Story of the Day
“Best service available, and I have tried them all.
Ross is the only one who spends his time trying to TEACH you how to do it rather than telling you buy this sell that.
It's like the old saying, "Give a man a fish you feed him for a day, Teach a man to fish, you feed him for life."
As a lifetime private trading club member I would Highly, Highly recommend TA to anybody, and I have recommended it to several of my friends and family.”
Embrace the surge,

Ross Givens
See more from Traders Agency on Google
Make us a preferred source and our market analysis will appear more prominently in your Google Search, Top Stories, and AI results.
Add to Preferred Sources