

Hey, Ross here:
If you’re still waiting for AI stocks to fully recover…
Take a look at what the rest of the market’s been doing.
Chart of the Day
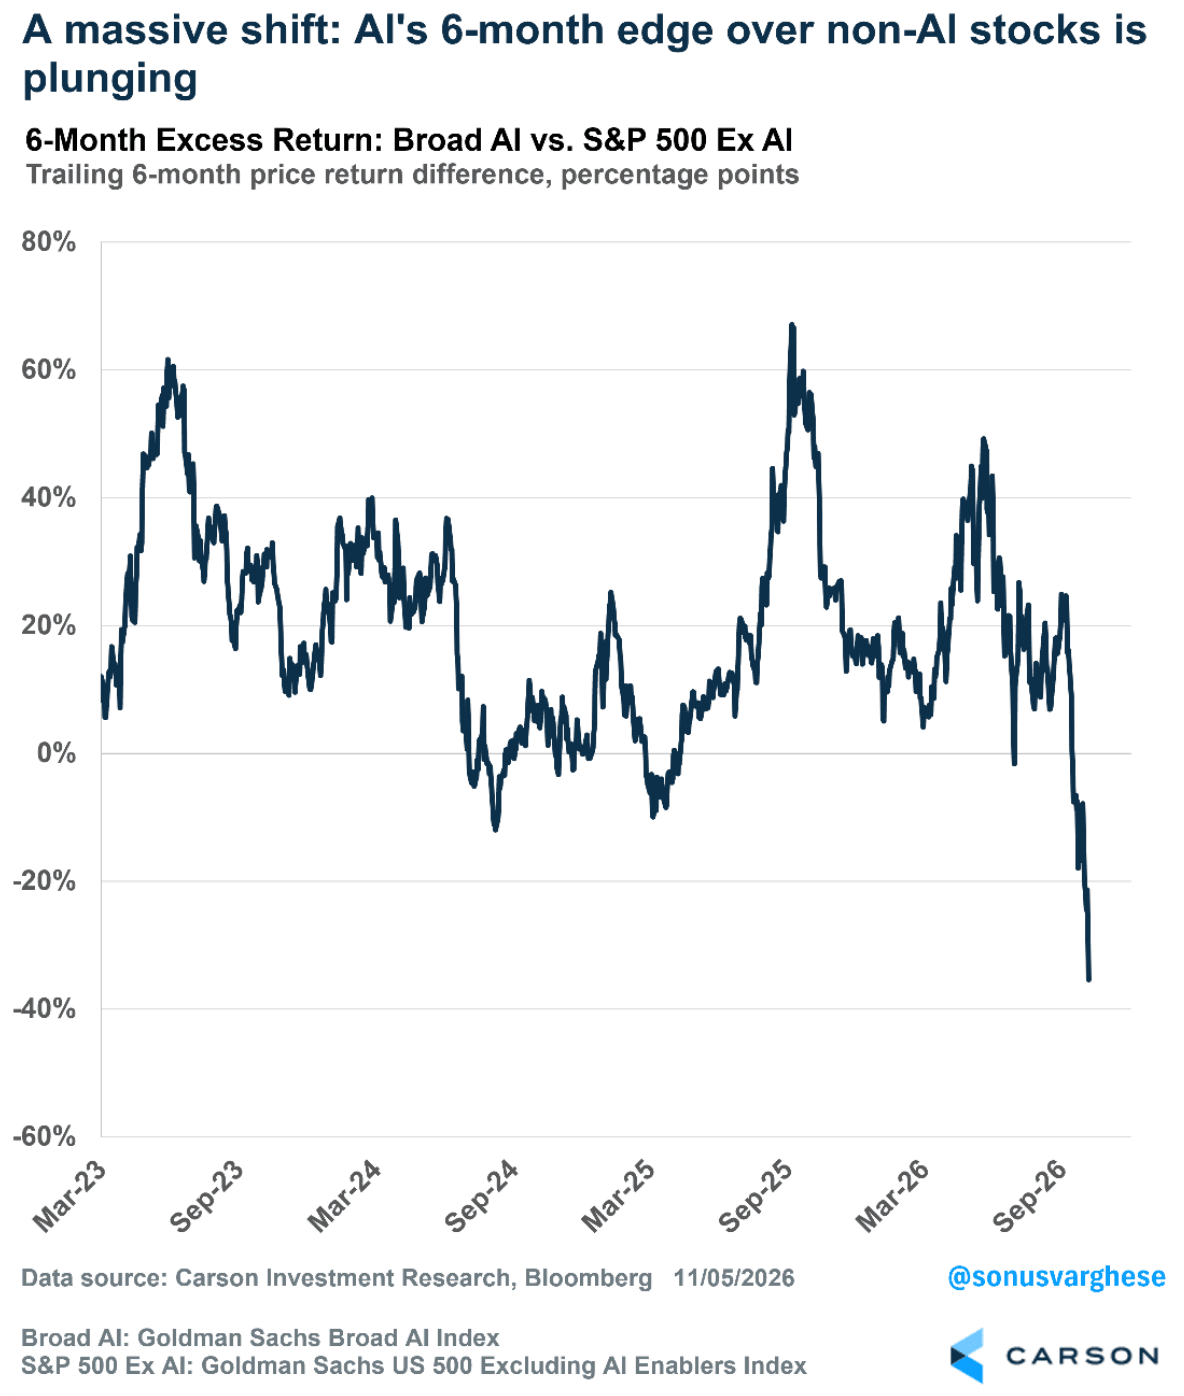
This chart compares AI stocks with stocks outside AI over six-month stretches.
Look at the far right.
Since 2023, AI stocks have generally been significantly outperforming their non-AI counterparts.
But right now, things have flipped.
AI stocks are now trailing non-AI stocks by the largest margin since this bull market began.
In other words, non-AI stocks are trouncing AI stocks right now.
And while there are fears that the tech selloff could spread into the rest of the market…
That’s not what options traders are pricing in right now.
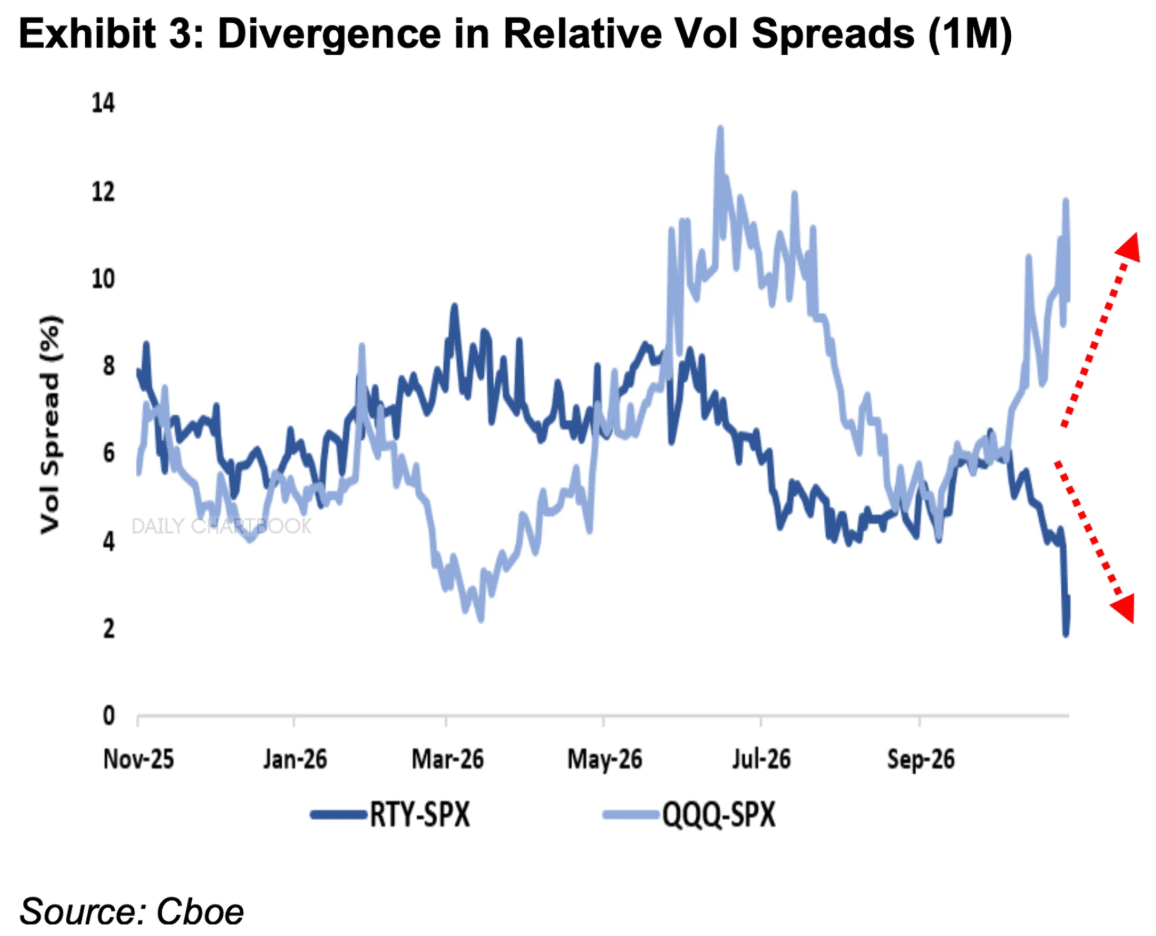
Both lines show how much extra volatility traders expect over the next month compared with the S&P 500.
QQQ tracks the tech-heavy Nasdaq 100. RTY tracks small caps.
The higher the line, the bigger the swings traders expect relative to the S&P.
Look at QQQ. That gap is close to a record high.
Now look at RTY. The gap for small caps is near its lowest in years.
If traders expected the tech rout to hit small caps just as hard, you’d expect that second line to climb too.
So far, they’re pricing most of that extra risk into tech – and barely any into the rest of the market.
Of course, that could change.
But those are the cards we’re dealing with right now.
And as I explain in the insight below…
Many traders aren’t playing those cards the right way.
Insight of the Day
Waiting for the last leader to bounce can cost you the next breakout..
Too often, traders become fixated on yesterday’s market leaders (this is especially the case if these leaders have been particularly dominant).
And this causes them to miss the breakouts happening under their noses today.
Look at what’s happening with AI now.
AI led this market for years. It’s been absolutely dominant in this bull market.
So it’s easy to keep waiting for those stocks to lead again.
But other stocks have been pulling ahead of AI for six months.
How many breakouts will you miss waiting for chip stocks to catch up?
Even if you call the bounce right, you’re late to those trades.
I’d look outside AI for the next big breakout.
And when it comes to targeting explosive breakouts…
There’s one chart pattern that’s never let me down.
The guy who wrote the book on chart patterns ranked this one No. 1 in both bull and bear markets…
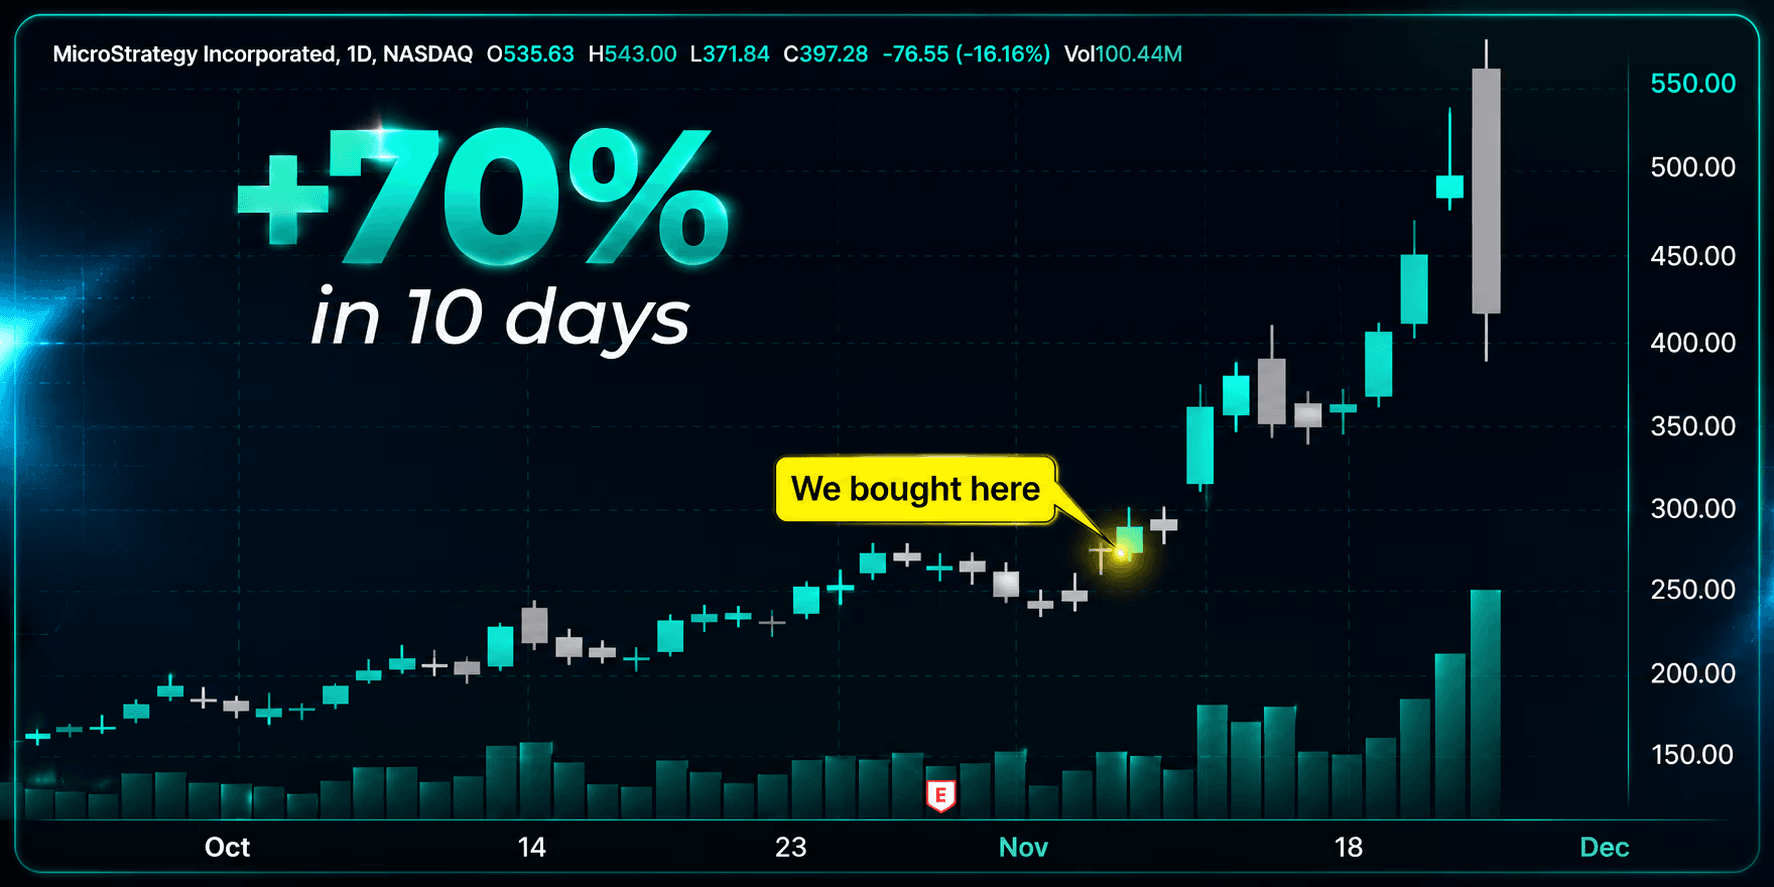
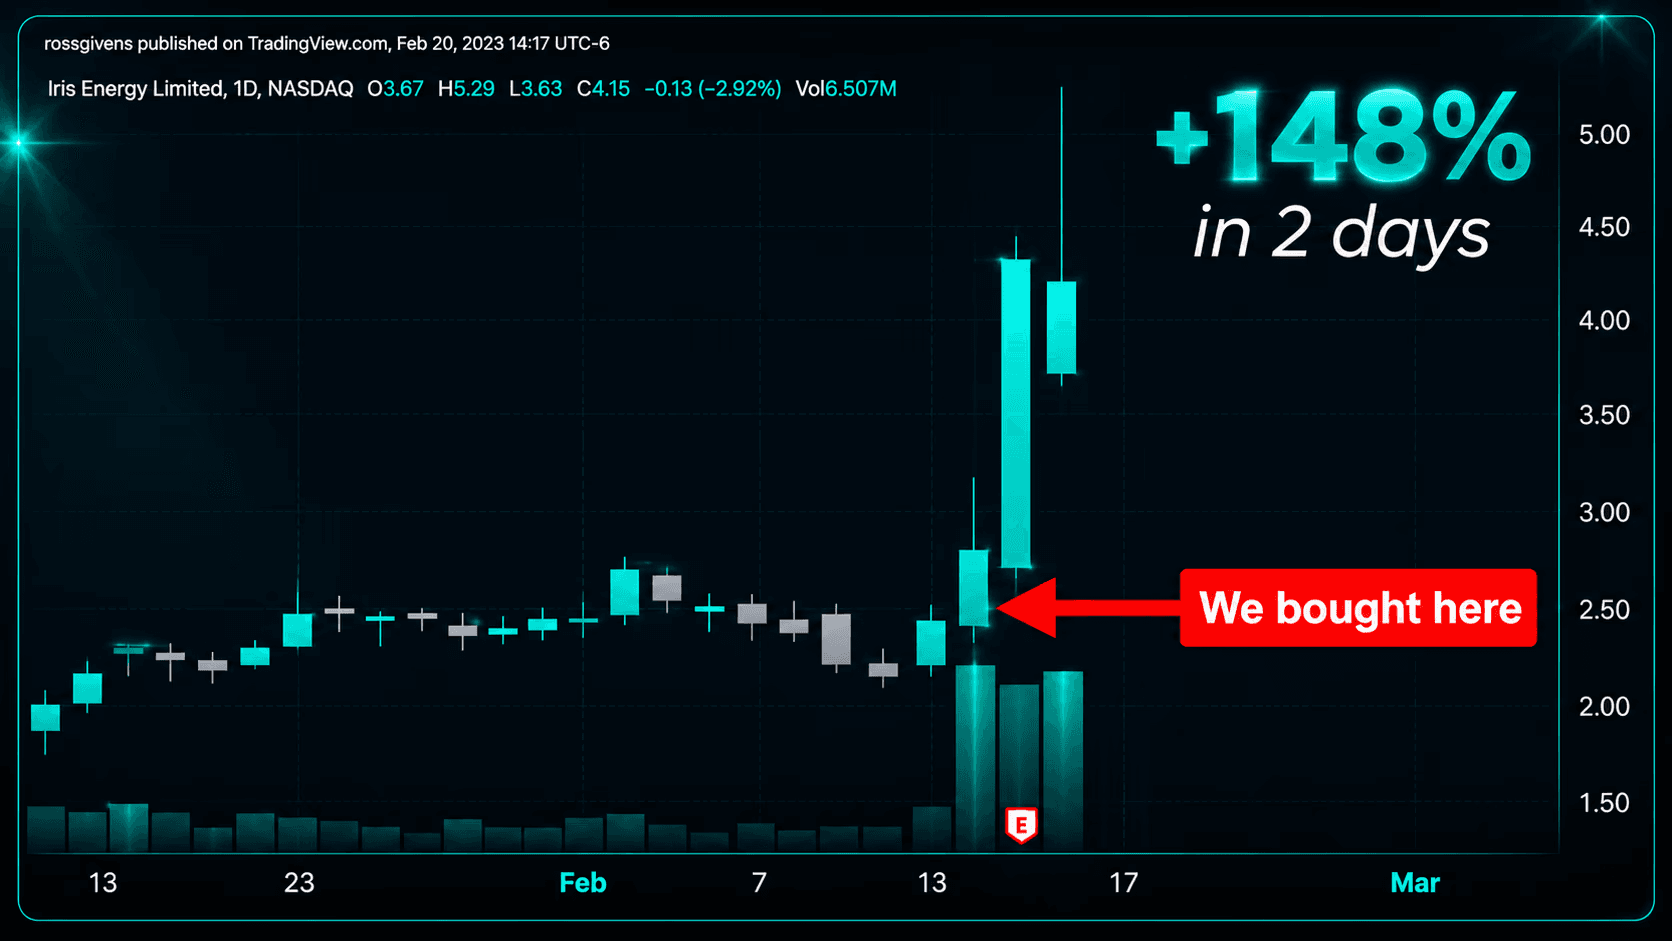
And it’s given our members a shot at gains like 70% in 10 days…
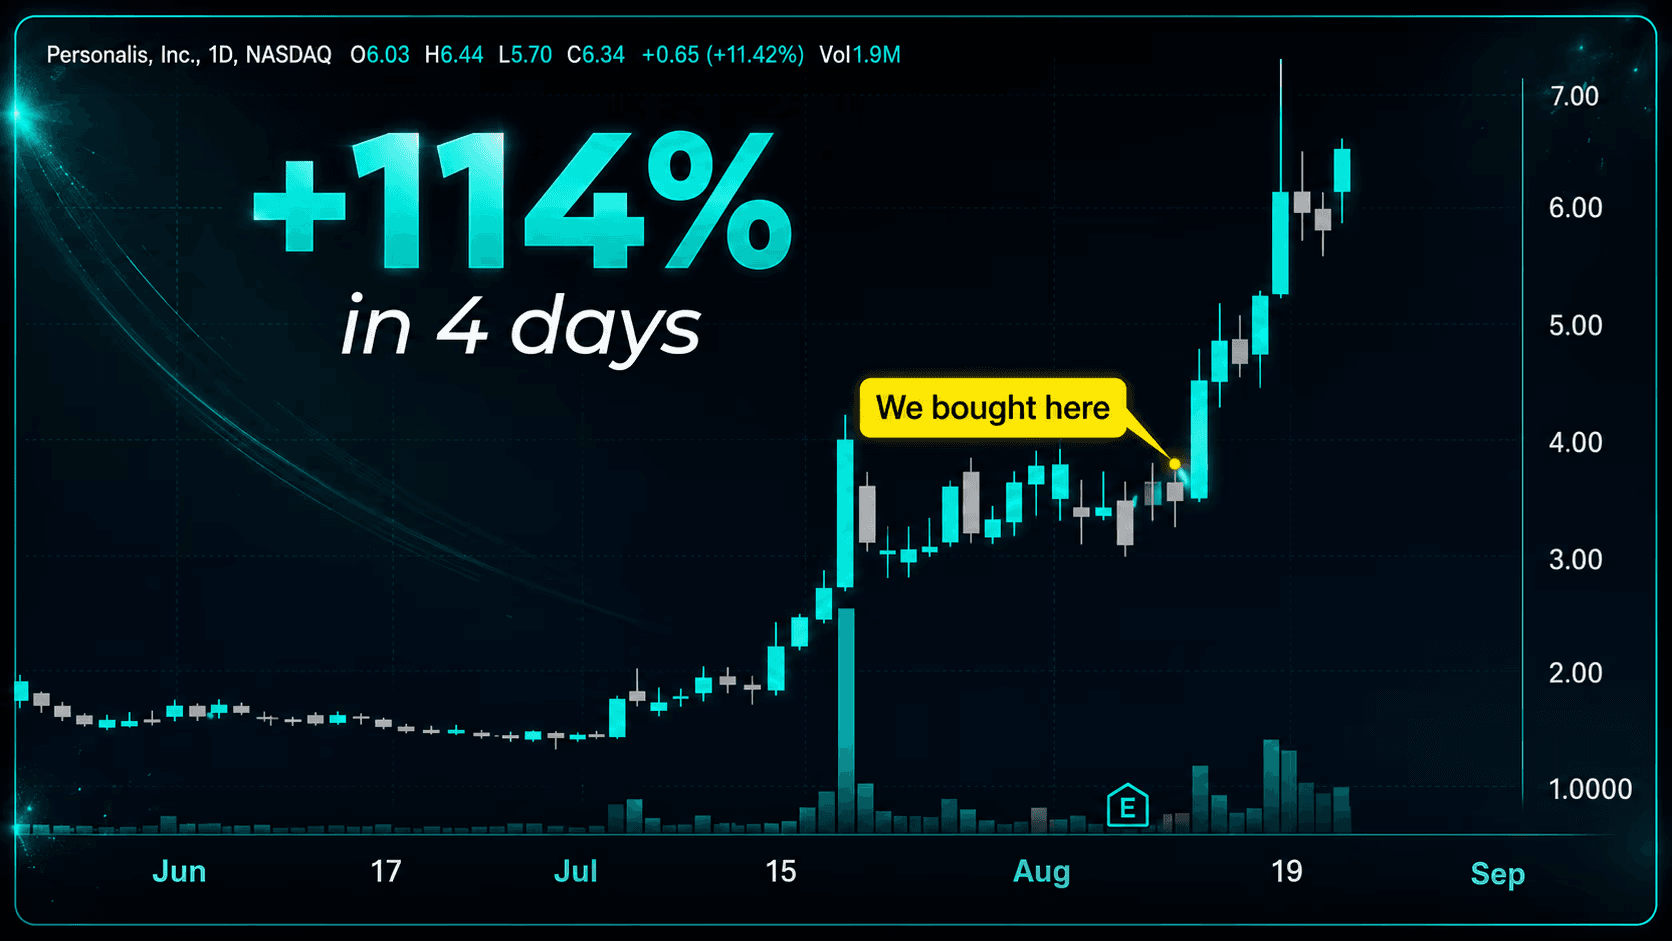
114% in 4 days…
And even 148% in just 2 days:
And later this afternoon at 3 p.m. Eastern…
I’m going LIVE to walk you through how to spot this prophetic pattern for yourself…
As well as give you the name and ticker of a stock that’s forming it right now…
With non-AI stocks performing so strongly…
NOW is the time to put this pattern to work for yourself.
So click here to lock in your free seat if you haven’t already…
And I’ll see you at 3 p.m. ET today.
P.S. If you’re planning to attend on a mobile device, make sure you download the presentation app now so you don’t miss anything when it starts. See you there.
iOS: apps.apple.com/us/app/goto/id1465614785
Android: play.google.com/store/search?q=goto&c=apps
Customer Story of the Day
“I have been trading since 1999 and follow both technical and fundamental analysis.
Ross is very knowledgeable and shares his insights into current trends.
You will learn how to look at charts and rinse and repeat for your own low risk trades.”
Embrace the surge,
Ross Givens
See more from Traders Agency on Google
Make us a preferred source and our market analysis will appear more prominently in your Google Search, Top Stories, and AI results.
Add to Preferred Sources