
Hey, Ross here:
Yesterday I told you about the hidden tech bear market.
Today, let me show you why tech stocks are likely to run into a lot more volatility.
Chart of the Day
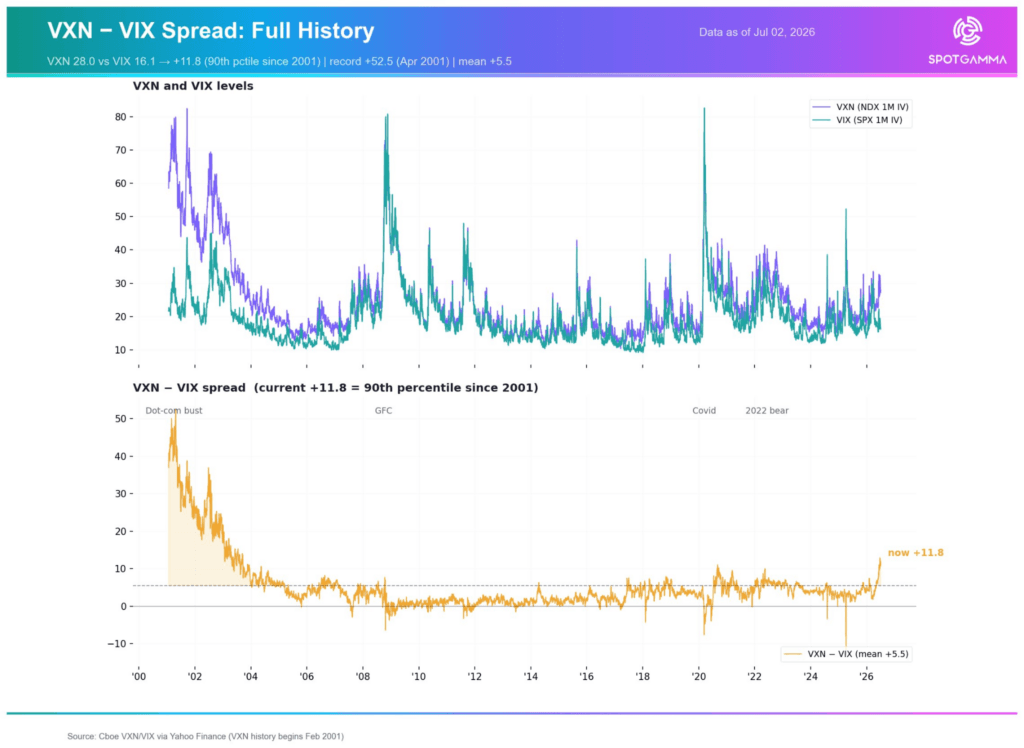
This chart shows the spread between the VXN and the VIX.
The VIX measures expected volatility in the S&P 500.
The VXN is basically the Nasdaq’s version of the VIX.
So this spread tells us how much more volatility traders expect from the Nasdaq compared with the broader market.
And right now, that spread is sitting around the 90th percentile going back to 2001.
In simple terms…
Traders are expecting Nasdaq stocks to move much more violently than the S&P 500.
You don’t usually see this kind of gap.
For years, investors treated QQQ and SPY like versions of the same trade.
Different indexes, sure…
But both were driven by many of the same mega-cap leaders.
Now that relationship is starting to crack.
The options market is saying tech volatility is breaking away from broad market volatility.
And this lines up with the second chart.
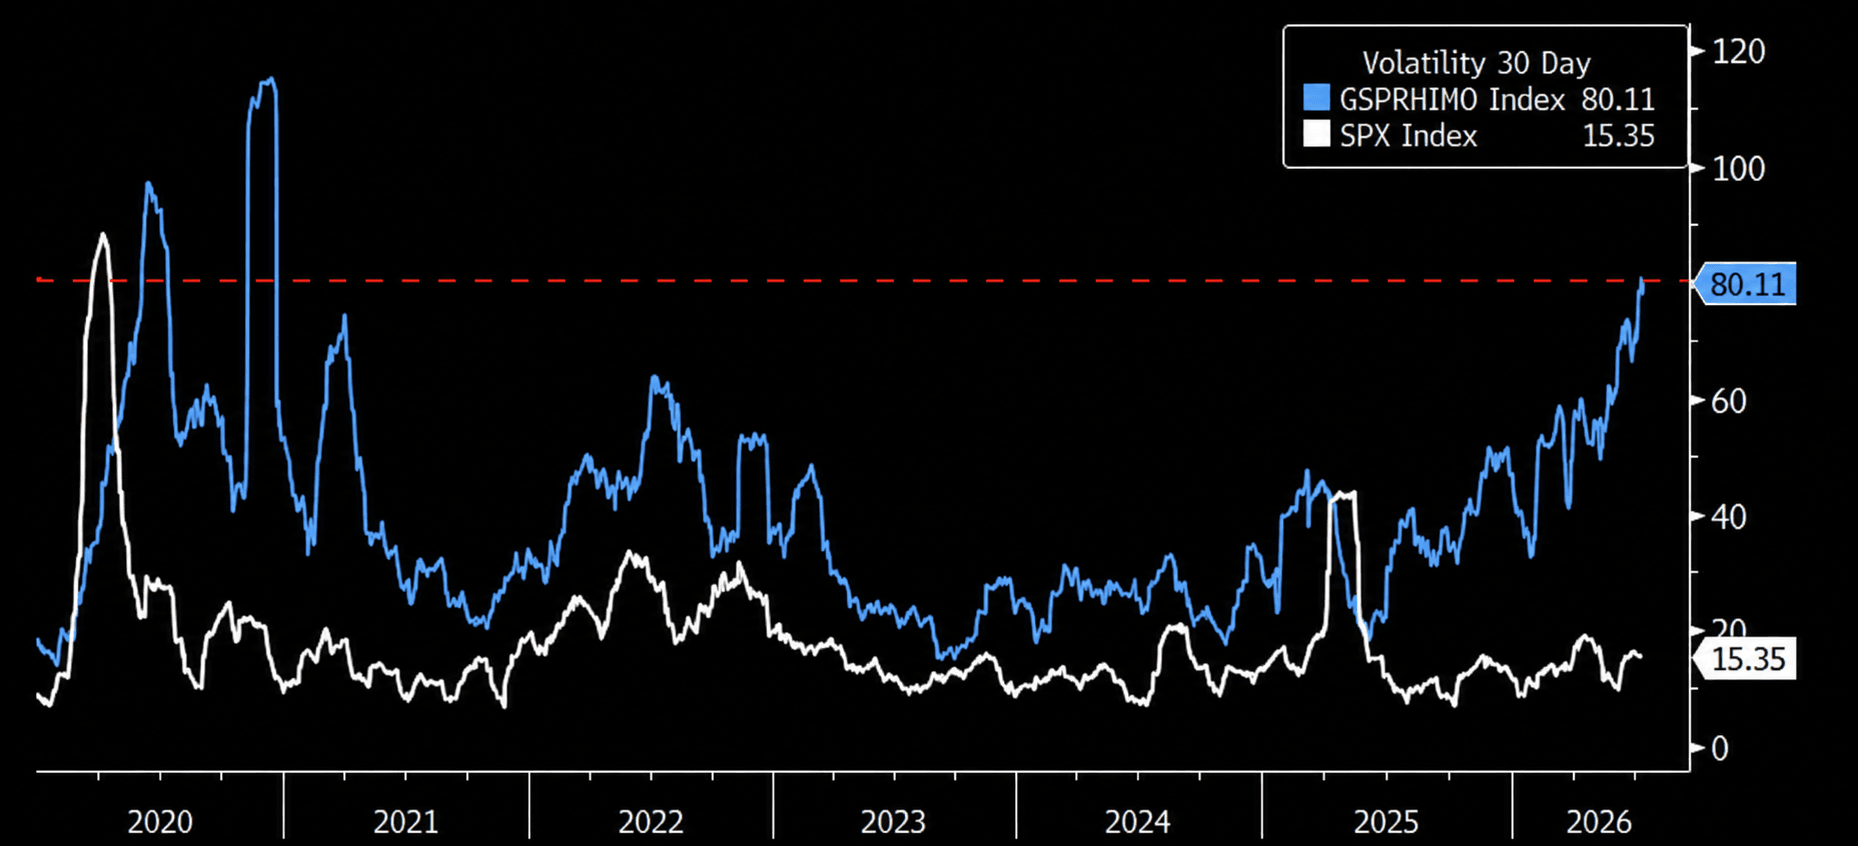
It shows volatility in high-momentum stocks compared with the S&P 500.
And high-momentum volatility is surging.
That tells us the same thing from another angle:
The stocks that led the rally are now becoming much more unstable.
This does not mean tech has to crash.
But it does mean the hidden weakness I showed you yesterday is starting to become something more visible:
A volatility event.
I explain below.
Insight of the Day
Volatility warnings are not sell signals – they are preparation signals.
This is where most traders get it wrong.
They see tech volatility rising…
And immediately assume the move is to dump tech.
Not necessarily.
When volatility expands, the market starts separating stocks fast.
Dispersion spikes.
Weak names break down harder.
Strong names break out stronger.
So the goal is not to make one blanket call on “tech” or “momentum”.
The goal is to prepare for the incoming volatility…
By finding the specific setups volatility is creating.
That’s why in just a few hours at 11 a.m. Eastern…
I’m going LIVE to show you exactly how to benefit from all this volatility…
Using a unique approach to trading this situation that’s previously yielded returns like 287%…
542%…
And 806% – all in a matter of weeks or even days.
This is a new strategy that will give you a unique edge in a unique market.
Don’t miss it – not with everything going on right now.
The session is free but we expect the room to fill out in minutes.
So click here to guarantee your spot if you haven’t yet…
And I’ll see you in just a bit at 11 a.m. ET.
P.S. If you’re planning to attend on a mobile device, make sure you download the presentation app now so you don’t miss anything when it starts. See you there.
iOS: https://apps.apple.com/us/app/goto/id1465614785
Android: https://play.google.com/store/search?q=goto&c=apps
Customer Story of the Day
“IF YOU WANNA MAKE MONEY, DO IT.
Hands down the best investment I’ve ever made.
Clear, simple and the most effective method I’ve come across. I’ve invested in training with other “gurus” who although they were good, they left out the most important part. … HOW TO FIND STOCKS.
Ross and his crew have completely hit it out of the park. With his method of entering and exiting my account is up 13% in a month.
I have multiple stocks currently at 50% gains after only a few weeks. The cost to join his memberships will be made back in less than a month. ….. unlike others out there”

Ross Givens
Editor, Stock Surge Daily
See more from Traders Agency on Google
Make us a preferred source and our market analysis will appear more prominently in your Google Search, Top Stories, and AI results.
Add to Preferred Sources