
Hey, Ross here:
Everyone’s worried about tech “overvaluation”.
But what if most tech stocks were already in a bear market?
Chart of the Day
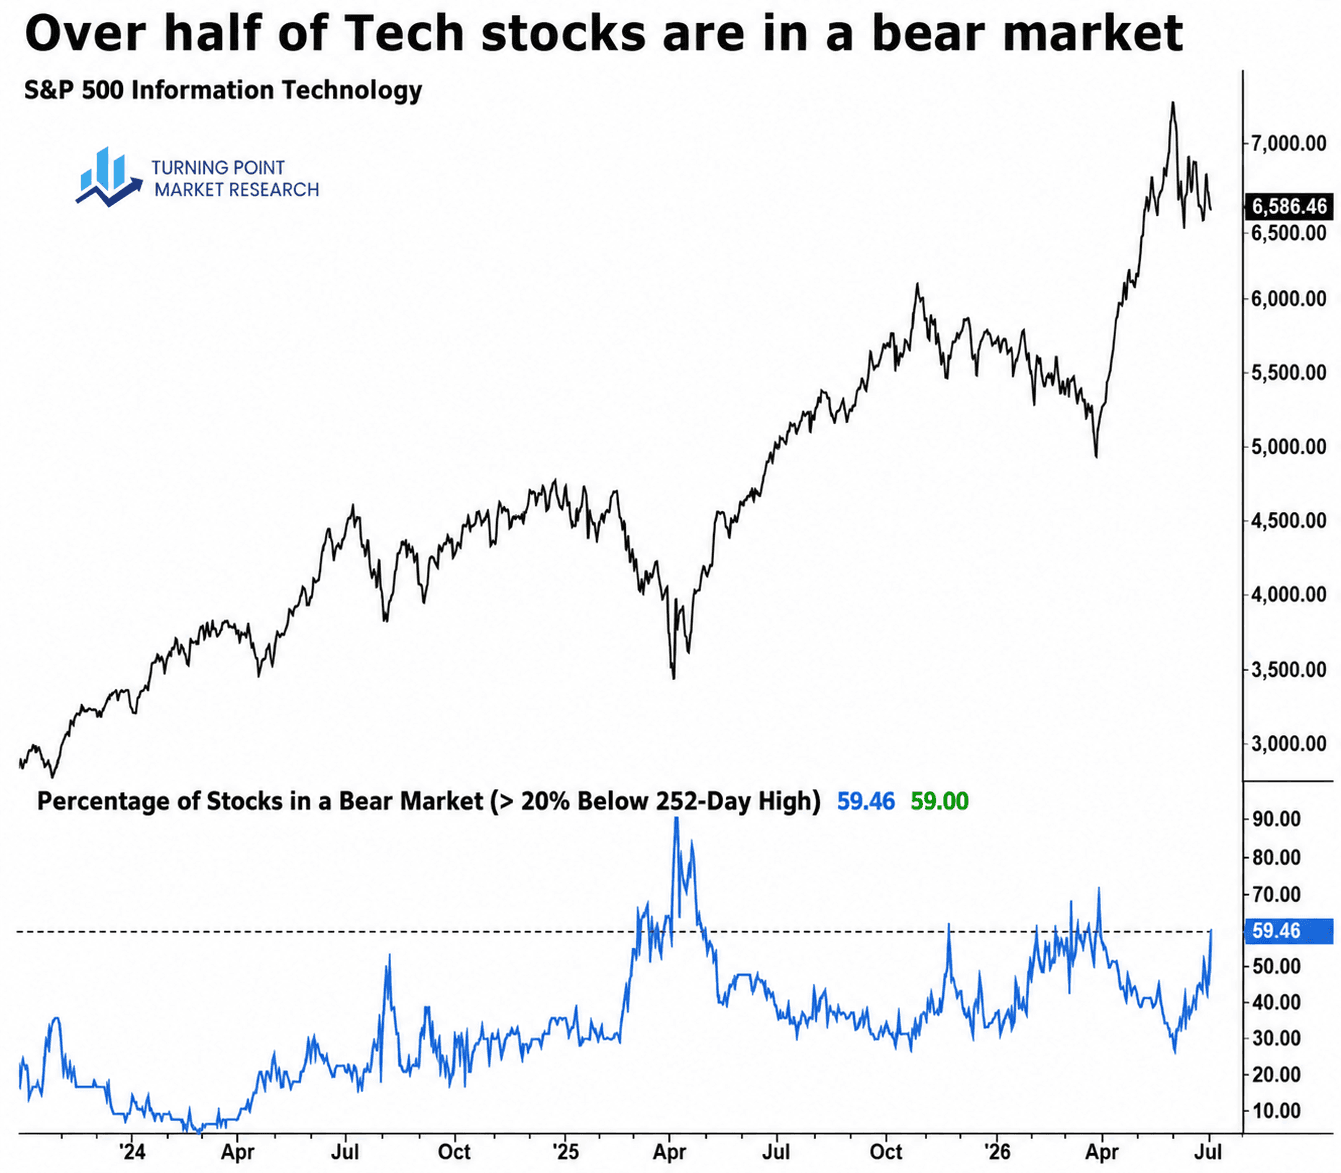
Here’s an interesting chart that shows that about 60% of tech stocks in the S&P 500 are trading at least 20% below their 52-week high.
According to the “standard” definition of a bear market…
That means the majority of tech stocks are in a bear market…
Something I’m willing to bet most traders – who are still worried about “overvaluation” – have no clue about.
In past newsletters, I’ve already shown how tech multiples have actually contracted this year…
Even as earnings growth has boomed.
And considering that the Iran war is heating up again…
We’ll likely see even more tech stocks fall into “bear market” territory within the next few weeks.
And yet, as I’ve also said recently…
The data is telling me that this bull market is still going strong.
I explain the apparent contradiction below.
Insight of the Day
The market is splitting apart under the surface
Under the surface, stocks are moving in completely different directions.
Some are breaking out.
Others are already down 20%, 30%, or more.
That’s why you can have a bull market and a bear market happening at the same time.
Sounds strange.
But that’s exactly what dispersion looks like.
And when dispersion gets this wide, being broadly “bullish” or “bearish” is not enough.
You need to know which stocks are still working…
Which ones are breaking down…
And how to profit from both sides of the move.
And with volatility spiking, so will this dispersion…
Leading to even more confusion and uncertainty in the market.
But volatility is not something to fear…
It’s something to use.
I’ll share more about my unique strategy for doing that tomorrow morning…
So keep an eye out for that.
But in the meantime, speaking of hidden bear markets…
Have you heard of the $58 billion trade nobody is talking about?
Customer Story of the Day
“Best service available, and I have tried them all.
Ross is the only one who spends his time trying to TEACH you how to do it rather than telling you buy this sell that.
It’s like the old saying, “Give a man a fish you feed him for a day, Teach a man to fish, you feed him for life.”
As a lifetime private trading club member I would Highly, Highly recommend TA to anybody, and I have recommended it to several of my friends and family.”

Ross Givens
Editor, Stock Surge Daily
See more from Traders Agency on Google
Make us a preferred source and our market analysis will appear more prominently in your Google Search, Top Stories, and AI results.
Add to Preferred Sources