
Hey, Ross here:
Markets are closed tomorrow for the start of the long weekend.
But before you head off…
Let’s look at why July might be the time to put your foot on the gas.
Chart of the Day
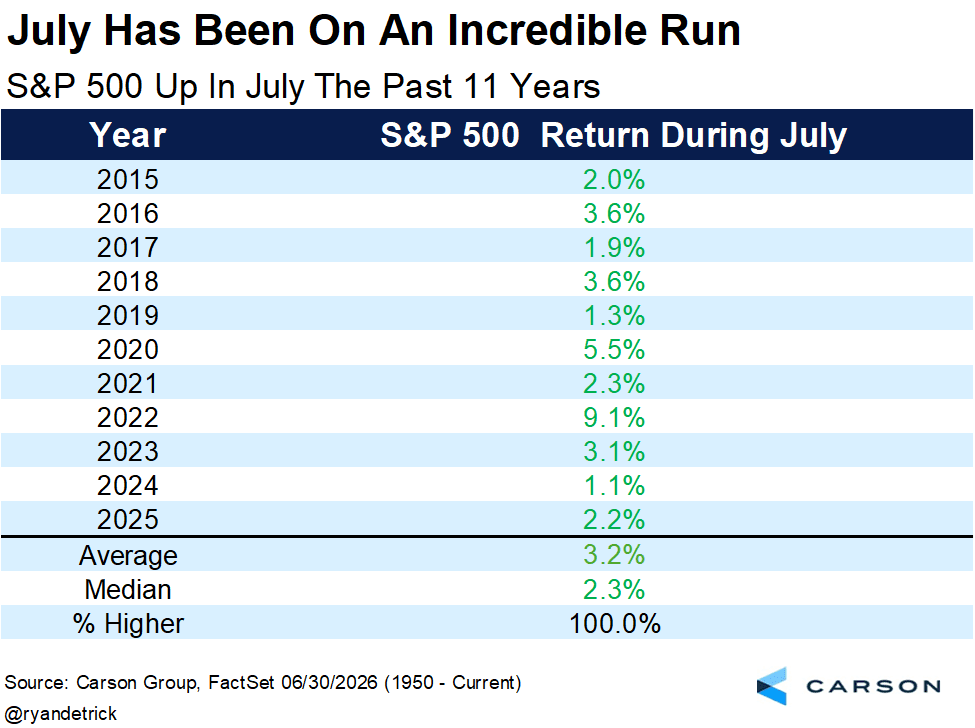
As today’s chart shows…
For the past 11 years straight, the S&P 500 has never closed lower in July.
It’s been the best month for the index for the past 20 years…
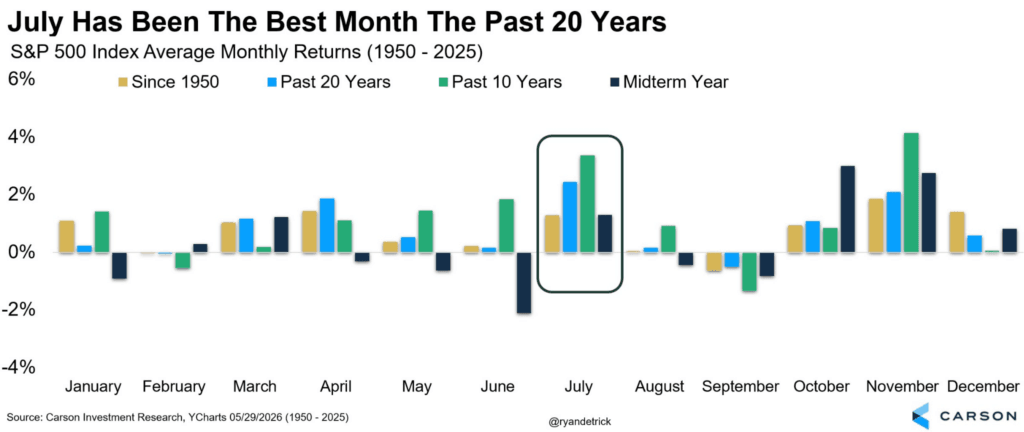
And even over the past 50 years, it is still one of the better months overall.
Now, factor in momentum…
With the data showing that, in years where the second quarter saw the S&P 500 return more than 10% (it did 14.9% this recent quarter)…
The rest of the year tends to look very good.
Like I said, it might be time to put your foot on the gas for July.
Especially because, as I explain below…
I’m seeing a very powerful pattern forming in the markets right now.
Insight of the Day
The broader market is signaling a very powerful breakout pattern right now
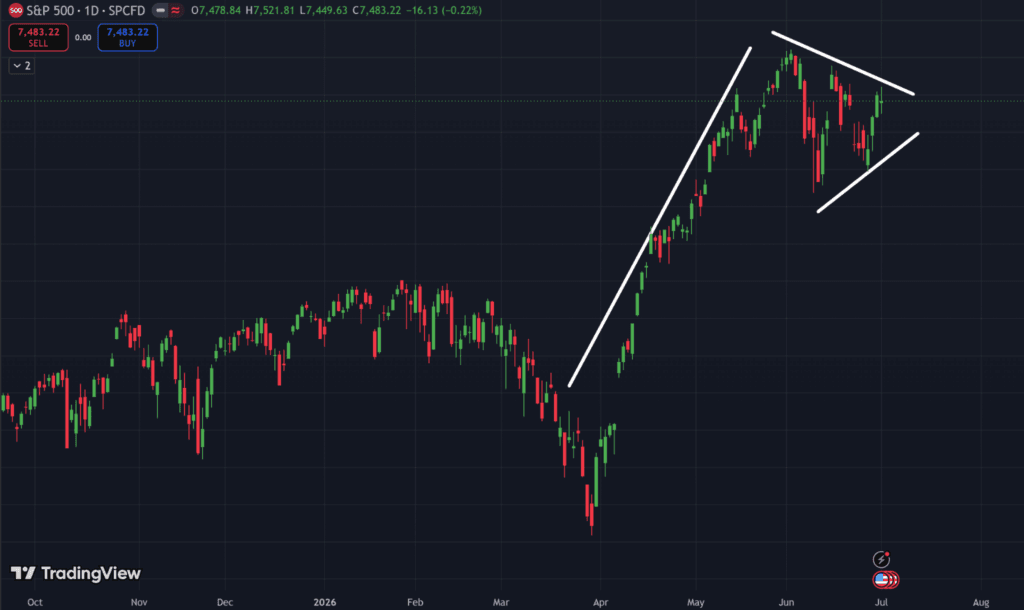
This right there is an extremely powerful bullish pattern forming in the S&P 500 right now.
And even beyond all the historical data I just showed you above…
This more than anything gives me the most confidence that the bull market will still go strong for the rest of the year.
But while spotting this pattern in the broader market is good…
Being able to spot this pattern in individual stocks – especially smaller, more volatile ones – is even better.
Every week, my team and I go live to hunt for these powerful breakout patterns in individual stocks.
It’s all part of my Black Ops Trading Club…
Where we’re on a mission to give as many people as possible the tools they need to reach financial freedom.
And speaking of freedom…
In honor of this great country’s 250th birthday…
You can now access a full YEAR of my Black Ops Trading Club for just $5.
That’s over a hundred live sessions – packed with hundreds of high potential trading ideas and cutting-edge market insights.
And all you need to do to claim it is to click here right now.
Customer Story of the Day
“Ross Givens & Traders Agency have helped me learn & identify market patterns with analysis as to WHEN and how to properly enter and exit trades, with profit!
It’s been 6 months so far, and the education has been excellent, with the profitable trades following!”
Ross Givens
Editor, Stock Surge Daily
See more from Traders Agency on Google
Make us a preferred source and our market analysis will appear more prominently in your Google Search, Top Stories, and AI results.
Add to Preferred Sources