
Hey, Ross here:
Most traders who want to know whether the market is nervous pull up the VIX.
Right now, that’s giving them an incomplete picture.
Because some of the biggest stress in the market isn’t showing up there at all.
Take a look.
Chart of the Day
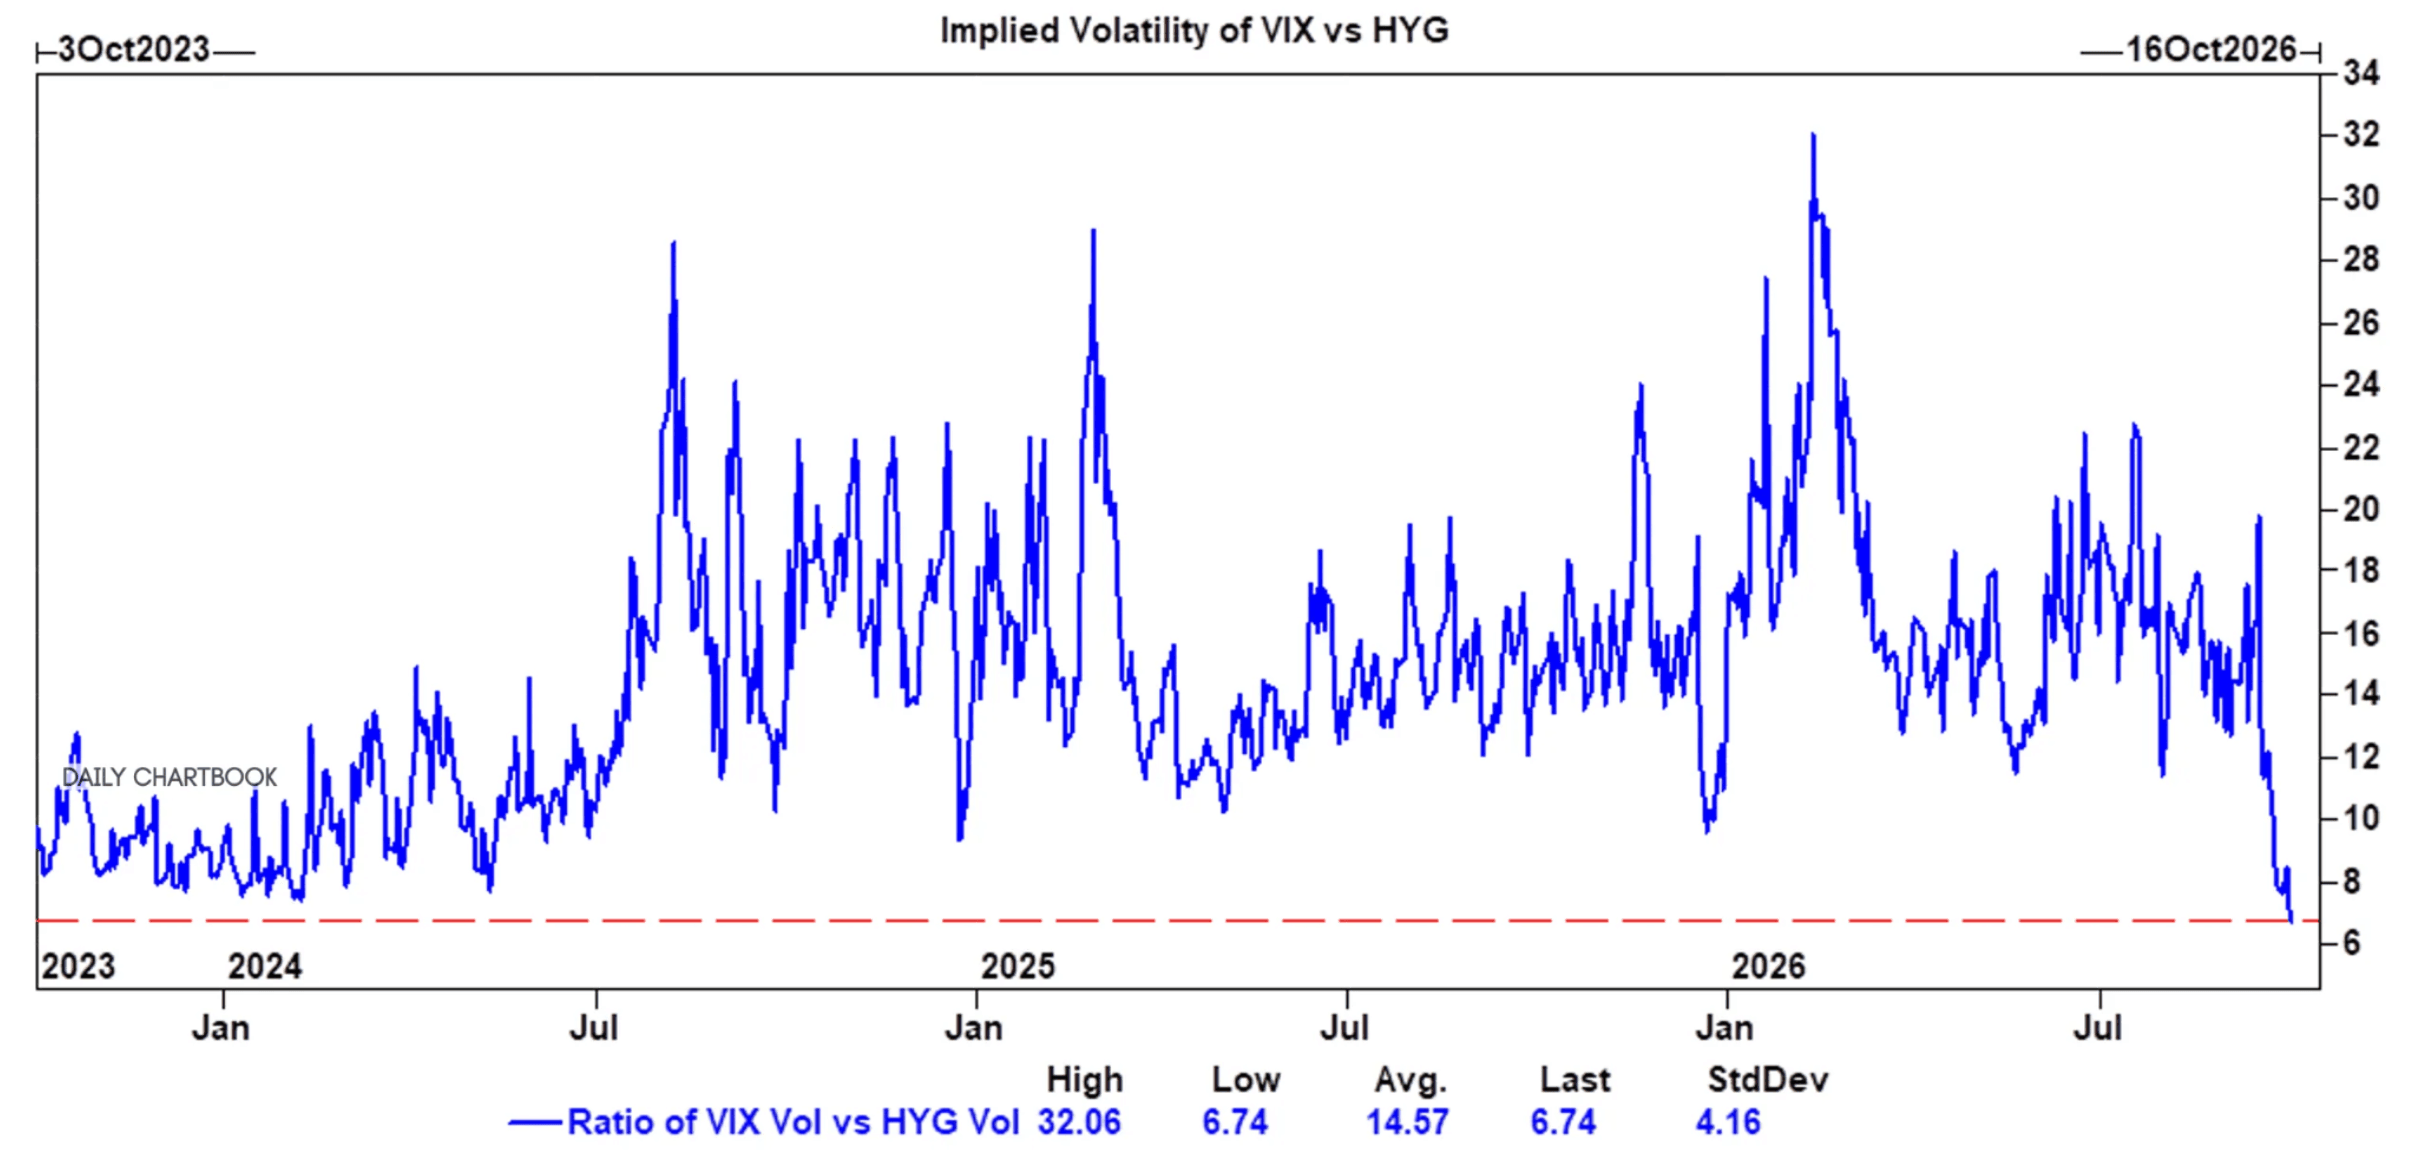
This compares volatility in the stock market with volatility in high-yield credit.
And the ratio just dropped to its lowest level in more than three years.
Translation: credit volatility has exploded relative to equity volatility.
The stock market still looks relatively calm.
Credit and rates do not.
Now, I’m not saying that means stocks are about to fall apart.
But if you’re only watching the VIX…
You’re missing where a lot of the stress is actually showing up.
And the same thing is happening inside the stock market itself.
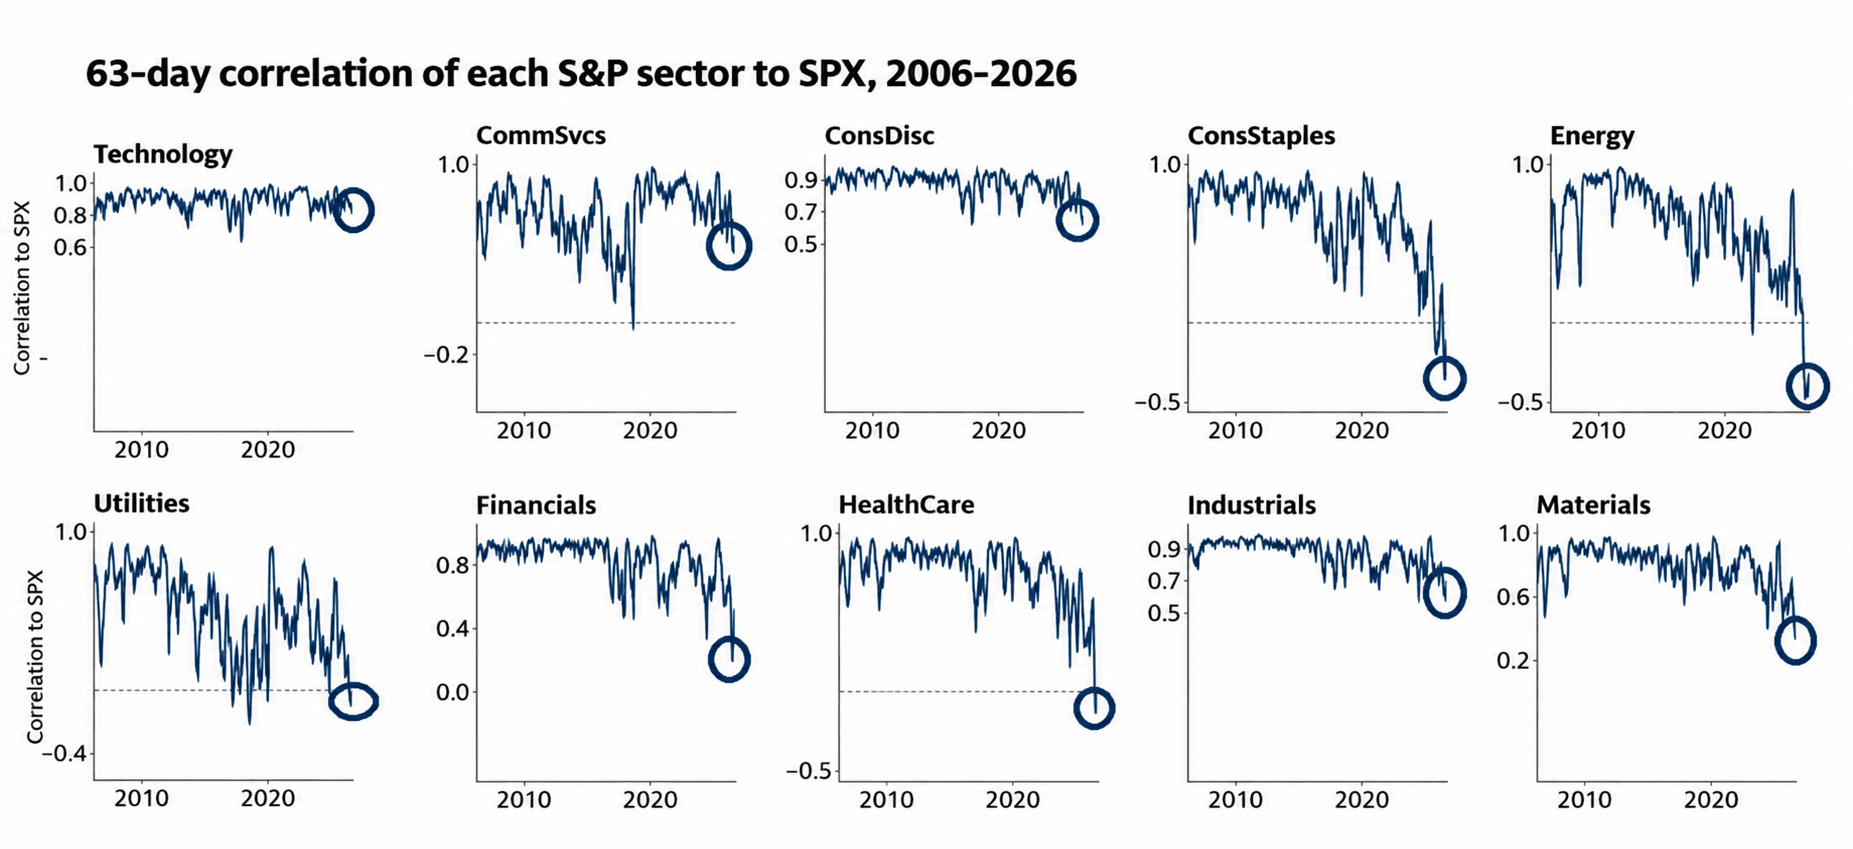
Several major sectors have stopped moving with the S&P 500.
Consumer Staples and Energy are now showing some of their most negative correlations to the index in two decades.
Utilities and Health Care have broken away too.
So the headline index is masking huge differences underneath.
And this is causing a lot of traders to miss critical info.
Insight of the Day
The broad market can look perfectly normal – while something very abnormal is happening below the surface.
Most traders watch the same obvious things.
The S&P. The Nasdaq. The VIX.
And when those look calm, they assume there isn’t much happening.
That’s how you miss some of the best clues in the market.
Because markets “leak” information all the time.
Sometimes that information shows up somewhere completely different from the headline index.
And sometimes it shows up in one trade that looks wildly out of place compared with everything around it.
That’s what we want to be looking for.
Not the surface-level move everybody can already see…
But the deeper signals that occur before the move becomes obvious.
One of my favorite examples happened with Synchrony Financial.
Three days before the company reported earnings, an anonymous investor placed a massive $651,000 bet on the stock.
There was no obvious public reason for a trade that aggressive.
But the trade was there.
And it stood out.
Using the system I’m demonstrating LIVE in just a few hours later today at 11 a.m. Eastern…
My top analyst put just $346 into the setup.
Three weeks later, that position was up 521%.
That’s the power of catching something abnormal before the rest of the market has an explanation for it.
And later today, I’ll show you exactly how we track these “invisible” signals.
It’s the same system that has flagged activity around moves like:
- 347% on Toast in eight days…
- 211% on Norwegian Cruise Lines in three days…
- And 806% on Nordstrom in just six days.
I’ll show you what makes these trades stand out…
How we separate the real signals from ordinary market noise…
And how you can start tracking the same underground activity yourself.
Click here to lock in your free seat if you haven’t yet…
And I’ll see you in just a bit at 11 a.m. ET.
P.P.S. If you’re planning to attend on a mobile device, make sure you download the presentation app now so you don’t miss anything when it starts. See you there.
iOS: apps.apple.com/us/app/goto/id1465614785
Android: play.google.com/store/search?q=goto&c=apps
Customer Story of the Day
"Traders Agency has a great system. Ross's training is great and support is there to assist even more."
Embrace the surge,
Ross Givens
See more from Traders Agency on Google
Make us a preferred source and our market analysis will appear more prominently in your Google Search, Top Stories, and AI results.
Add to Preferred Sources