
Hey, Ross here:
Every time stocks push to new highs, the bubble comparisons start flying.
AI stocks have ripped.
The S&P 500 is near records.
So naturally, 1999 gets dragged back into the conversation.
But when I look at what’s actually happening underneath this rally…
I see some major differences.
Take a look:
Chart of the Day
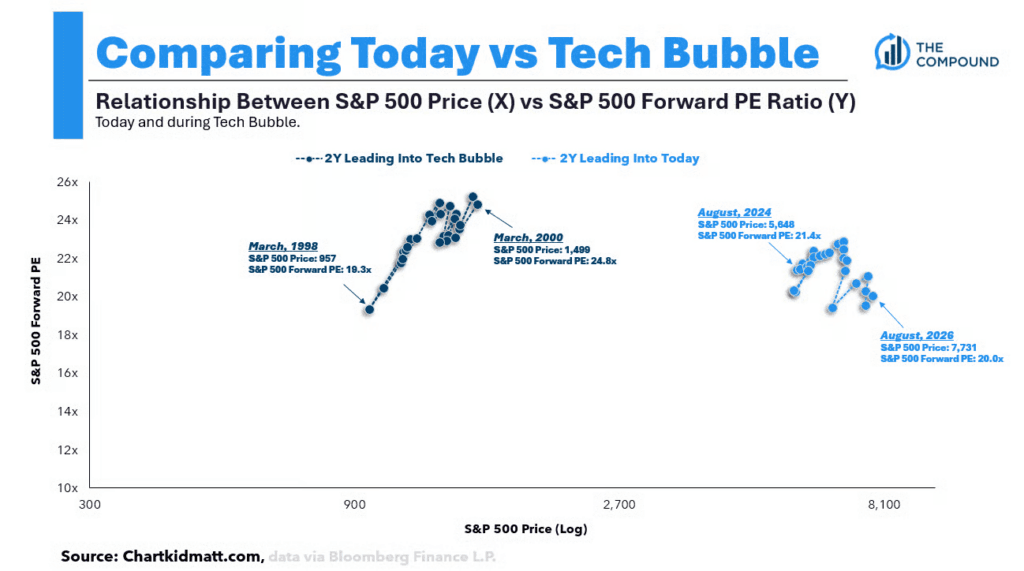
The dark-blue dots show the two years leading into the dot-com peak.
From 1998 to March 2000, the S&P 500 climbed sharply.
But investors were also paying more and more for every dollar of earnings.
The forward P/E ratio jumped from about 19.3x to 24.8x.
That’s classic bubble behavior.
Prices go up…
Then investors keep stretching valuations even further to chase them.
Now look at the light-blue dots.
Over the past two years, the S&P has climbed substantially…
But its forward P/E has actually fallen from roughly 21.4x to 20.0x.
That doesn’t make stocks cheap.
But it looks very different from the valuation blowout we saw heading into 2000.
And the rally itself looks different too.
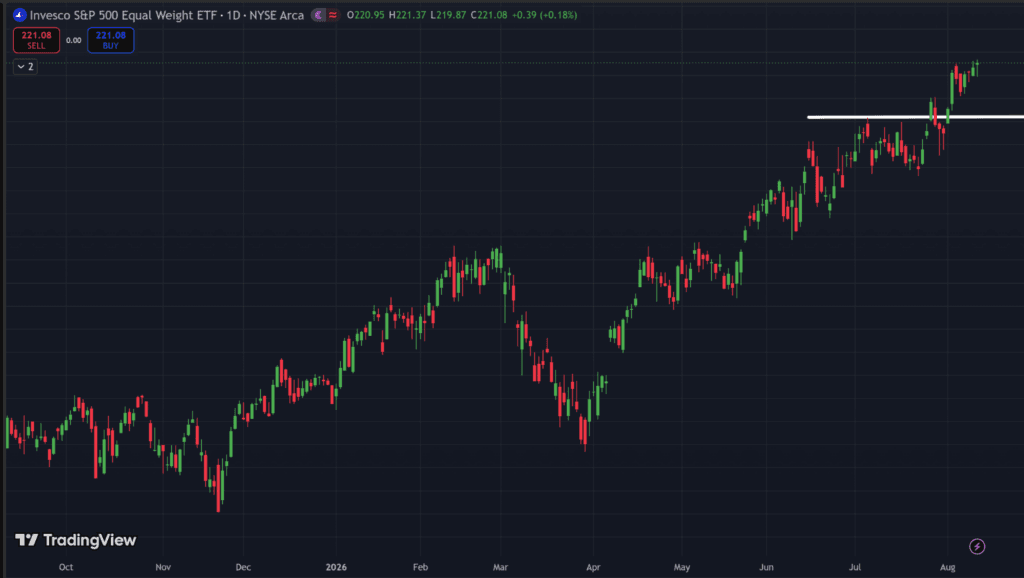
This is the equal-weight S&P 500.
Instead of letting the biggest companies dominate the index, every stock gets roughly the same weight.
And it has decisively broken out to new highs.
So this isn’t only a few AI giants dragging the market higher.
The average S&P stock is moving too.
And if this were simply one giant U.S. AI mania…
You’d have a hard time explaining this next chart.
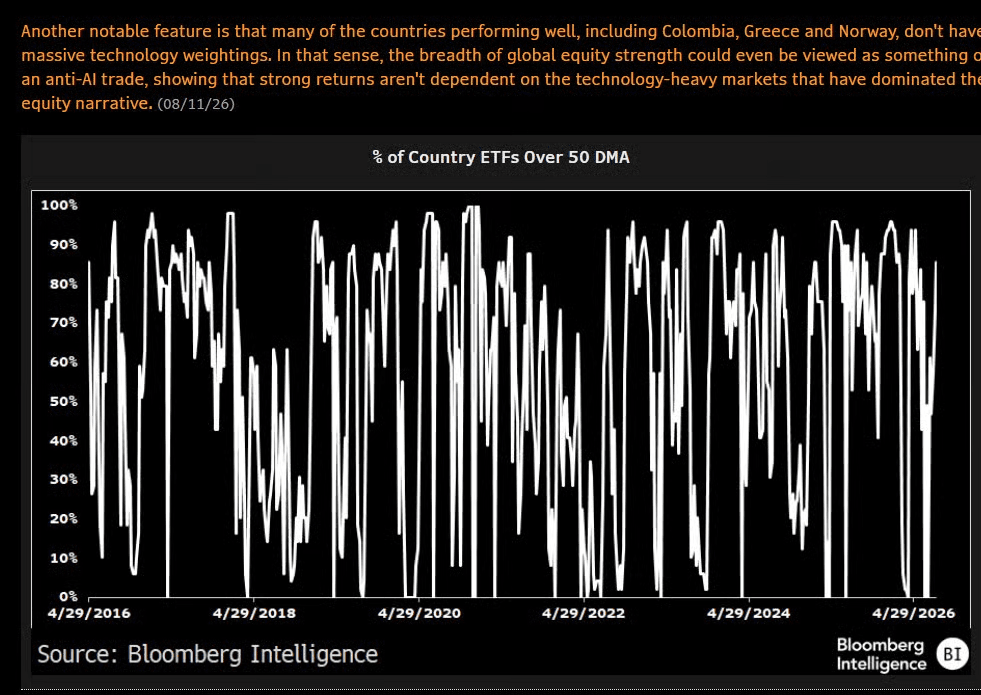
More than 80% of country ETFs around the world are trading above their 50-day moving averages.
That includes markets without massive technology sectors.
The strength is showing up all over the place.
And there’s also a very friendly financial backdrop behind it.
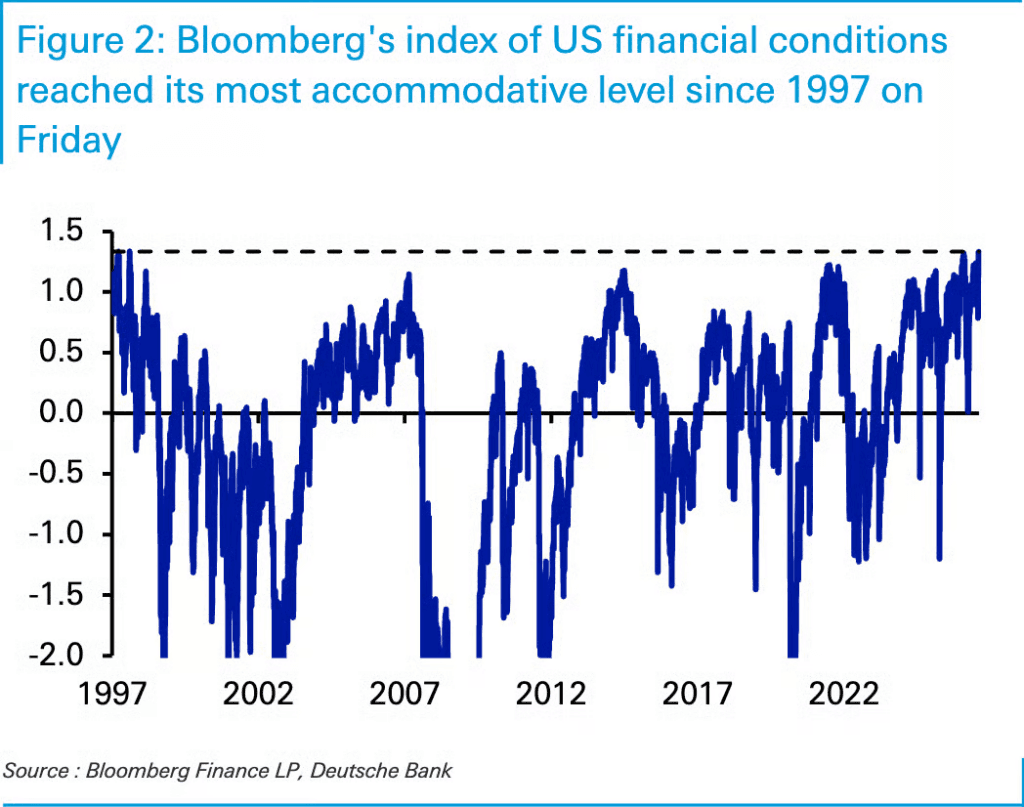
U.S. financial conditions are now around their most accommodative level since 1997.
Credit is flowing.
Liquidity is plentiful.
Put it all together and I have a hard time looking at this market and simply yelling “1999!”
Don’t get me wrong – stocks aren’t cheap. There will be pullbacks.
And plenty can still go wrong.
But right now, this rally has broader participation, a supportive financial backdrop, and nothing close to the valuation expansion we saw at the height of the dot-com mania.
That’s good news.
But it can also make individual stocks harder to judge.
I explain below.
Insight of the Day
When everything looks good, I want more clues.
A strong market gives me more stocks to work with.
That’s a good problem to have.
But it can also leave me staring at 20 or 30 charts that all look pretty good.
The price action can help me narrow that list.
Then I like to dig deeper.
And one thing I’ve always wanted to know is what the people closest to the action are doing with their own money.
If I like a stock technically…
And then I see the CEO buying shares…
That gets my attention.
Same thing if a politician suddenly takes a position in the company.
Or another elite trader starts showing up in the stock.
None of that replaces proper analysis.
And I’m certainly not going to blindly copy somebody else’s trade.
But it gives me another piece of information I can use when I’m deciding which stocks deserve a closer look.
The problem is that tracking all of these people has traditionally been a pain.
Corporate filings are in one place.
Political disclosures are somewhere else.
Then you have all the other traders you may want to follow.
So over the past several months, my team and I have been building a way to bring all of that together.
It’s called InsiderIQ.
And tomorrow, Friday August 14 at 11 a.m. Eastern, I’m unveiling it LIVE.
This goes far beyond the corporate-insider research you’ve seen me use before.
I’ll show you how InsiderIQ can track politicians, corporate executives and other elite market players…
And reveal some of the top stocks U.S. representatives are trading right now.
Click here to secure your free seat early…
And I’ll see you tomorrow at 11 a.m. ET.
P.S. If you’re planning to attend on a mobile device, make sure you download the presentation app now so you don’t miss anything when it starts. See you there.
iOS: https://apps.apple.com/us/app/goto/id1465614785
Android: https://play.google.com/store/search?q=goto&c=apps
Customer Story of the Day
“★★★★★
I’ve had a great experience with Ross Givens and Traders Agency.
Ross does an excellent job of breaking down complex market concepts into easy-to-understand lessons, making it valuable for both new and experienced traders.
The educational content, market insights, and trade ideas are well-researched, and the customer support team has always been responsive and professional.
I appreciate the focus on teaching the “why” behind each strategy rather than just giving alerts.
If you’re looking to improve your trading knowledge and confidence, I highly recommend giving Traders Agency a try.”

Ross Givens
Editor, Stock Surge Daily
See more from Traders Agency on Google
Make us a preferred source and our market analysis will appear more prominently in your Google Search, Top Stories, and AI results.
Add to Preferred Sources