The stock market is staging a sharp comeback this Thursday morning, rebounding from a heavy Fed-triggered sell-off. We're tracking a fast recovery across the major indices, with the Dow Jones Industrial Average trading at 51,975.52, a gain of 381.38 points or 0.74%.
This move follows a turbulent Wednesday session in which the Nasdaq-100 entered correction territory on heavy declines in chip stocks. Right now, traders are processing a massive divergence in tech earnings alongside a sudden revolt in the bond market. The numbers tell a clear story, and we're adjusting our tracking models to account for these rapid intraday swings.
What Is the US Stock Market Doing Today?
The market is rallying sharply, with the Nasdaq Composite jumping 1.5% to lead the recovery. The S&P 500 rose 0.8%, while the Dow advanced 0.5% in early trading. Our data points to a significant rotation happening beneath the surface of these headline index gains.
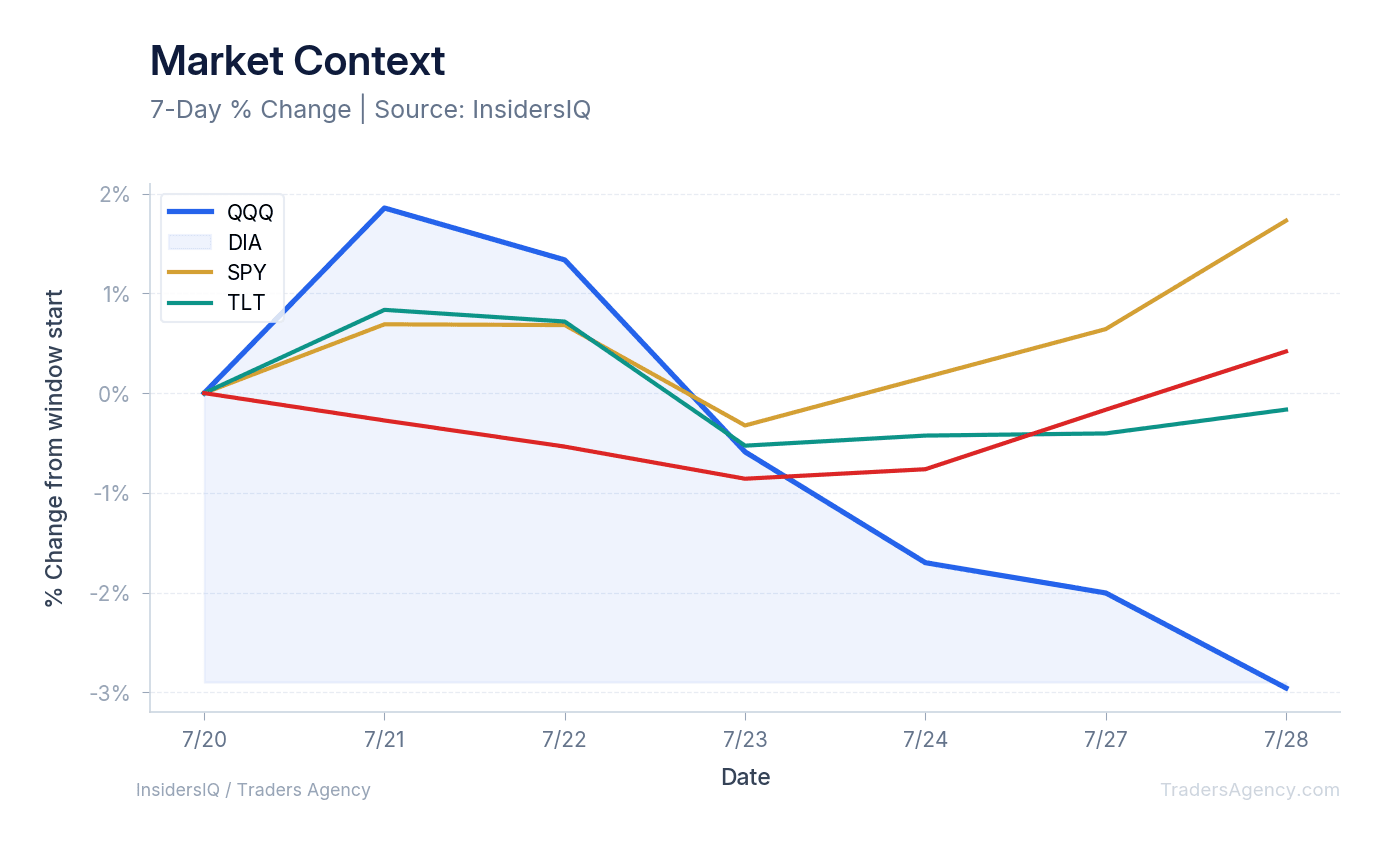
The 10-day performance metrics give us a clearer read on the recent trend. The DIA shows a price change of +1.73% over the last 10 days. The SPY, by contrast, is down 0.17% over the exact same window. The QQQ has taken the hardest hit, posting a 10-day price change of -2.96%.
The News: Tech Earnings Split the Market
We're watching a historic split between two Magnificent Seven stalwarts. Microsoft (MSFT) is leading the tech gains, with shares jumping more than 11%. That surge comes after the company reported its Azure cloud business topped $100 billion in revenue for the first time. Even with the daily pop, MSFT still shows a 10-day price change of -2.22%.
On the other side of the trade, Meta (META) shares fell about 9% in early trading, extending a historic losing streak for the social media giant. An earnings miss has amplified worries about the company's ability to recoup heavy AI investments. The 10-day data confirms the weakness, with META down -8.12%.
The Number: Microsoft's Azure cloud business topped $100 billion in revenue for the first time, sending MSFT up more than 11%, while META dropped roughly 9% on an earnings miss.
How Is the Fed Rate Hold Hitting Bond Markets?
The Federal Reserve's decision to hold rates steady on Wednesday is triggering a revolt in the bond market. The 30-year Treasury yield surged to a multidecade high near 5.24% on Thursday. We're urging traders to watch this yield spike closely, because it feeds directly into equity valuations.
Our tracking of the TLT exchange-traded fund shows a 10-day price change of +0.42%. This bond reaction lands alongside new economic reports that complicate the trading picture. The PCE pricing data released Thursday showed inflation advancing at a slower pace in June than the prior month.
That slower inflation print is welcome news for the Fed. At the same time, GDP data from the Commerce Department showed the US economy grew more slowly than expected in the second quarter.
Want expert trading insights delivered daily?
Join thousands of traders who rely on Traders Agency for market analysis and trade ideas.
Join Traders AgencyWhat This Means for Traders
This price action creates a highly volatile setup for anyone trading the Nasdaq today. The divergence between cloud revenue success and AI investment fears demands precise stock selection. Traders can't lean on broad index buying when individual components are posting double-digit moves in opposite directions.
Here are the key takeaways from the current setup:
- Dow strength: The industrial average is showing relative strength, with the DIA outperforming tech over the past two weeks.
- Clear recovery: Live index data confirms a rebound from Wednesday's Fed-fueled sell-off.
- Trader demand surging: Searches for a reliable US stock market live chart are spiking as traders try to track these rapid intraday swings.
- Support holding: The current Dow chart shows immediate technical support holding at the open.
What Should Traders Watch Next?
We're preparing for several immediate events that will drive volume into the afternoon session. Expect high volatility straight through the closing bell.
1. Amazon (AMZN) Earnings
Amazon is the next hyperscaler scheduled to report after the bell. We'll be watching capital expenditures and overall cloud performance most closely.
2. Apple (AAPL) Margins
Apple releases its results shortly as well. Our focus centers on profit margins, specifically in relation to recent memory chip price hikes.
3. Geopolitical Risks and Oil
We're monitoring international developments carefully. US strikes hit a dozen Iranian targets overnight. While oil prices held flat Thursday morning, this event threatens to spiral into further escalation. A broader conflict carries the direct risk of rekindling inflation.
The Bottom Line
Today's market is defined by a massive tech divergence and a historic bond market reaction. We're adjusting risk parameters around the 5.24% 30-year Treasury yield and the upcoming earnings from Apple and Amazon. We expect the volatility in chip stocks and hyperscalers to set the primary market trend through the end of the week.
Want expert trading insights delivered daily?
Join thousands of traders who rely on Traders Agency for market analysis and trade ideas.
Join Traders AgencyKey Takeaways
- The Dow Jones rebounded 381.38 points (0.74%) to 51,975.52 on Thursday morning after a Fed-triggered sell-off wiped out gains Wednesday.
- Microsoft surged more than 11% on earnings, while chip stocks dragged the Nasdaq-100 into correction territory, creating a sharp split inside the tech sector.
- The 10-day performance gap between indices tells the real story: DIA is up 1.73%, SPY is down 0.17%, and QQQ is down 2.96%.
- The 30-year Treasury yield hit 5.24%, signaling a bond market revolt that traders need to factor into risk parameters alongside equity moves.
- Overnight US strikes on Iranian targets kept oil flat for now, but traders should monitor escalation risk as a potential inflation catalyst heading into the weekend.
DISCLAIMER: Traders Agency does not offer financial advice. The information provided is for educational purposes only and should not be considered financial advice. Traders Agency is not responsible for any financial losses or consequences resulting from the use of the information provided. Trading carries inherent risks and may not be suitable for all individuals. You are advised to conduct your own research and seek personalized advice before making any investment decisions, recognizing the potential risks and rewards involved.
See more from Traders Agency on Google
Make us a preferred source and our market analysis will appear more prominently in your Google Search, Top Stories, and AI results.
Add to Preferred Sources