
Hey, Ross here:
There’s a lot of confusion in the market right now.
And one of the reasons for that is we’re seeing bigger winners – and bigger losers.
Chart of the Day
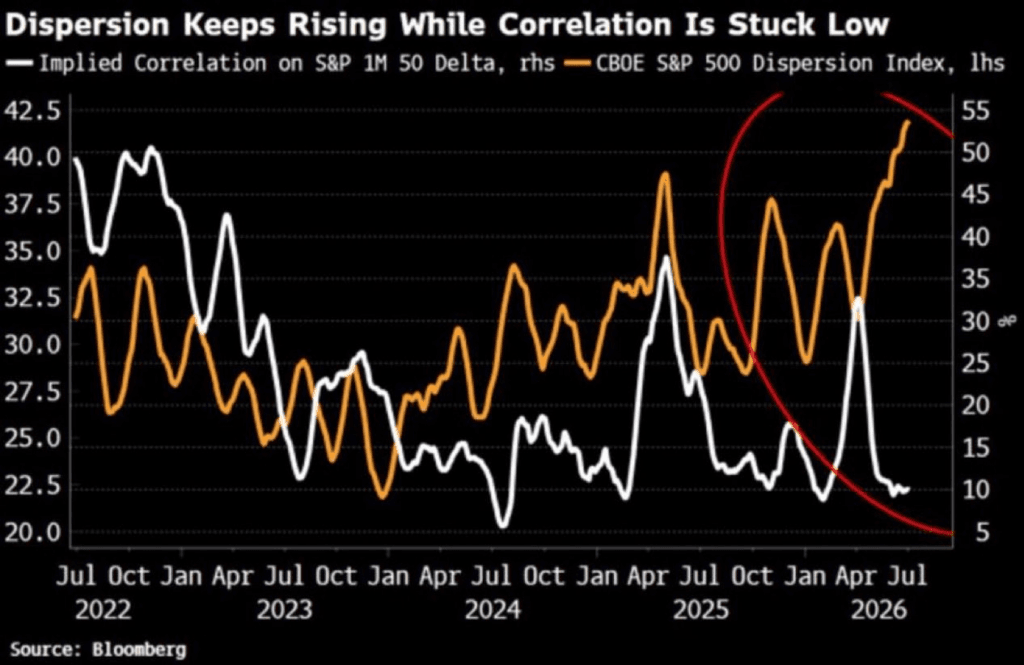
Take a look at this chart.
The orange line shows dispersion – basically, how far apart individual stock returns are moving.
The white line shows correlation – how closely stocks are moving together.
Right now, dispersion is surging…
While correlation remains stuck near historic lows.
In plain English, stocks are no longer moving as one big pack.
Some are ripping higher.
Others are getting crushed.
And when all those moves get blended together inside the S&P 500, the index can look relatively calm…
Even while there’s chaos underneath.
That’s why this market feels so confusing.
The broad indexes are hiding just how violent the stock-by-stock moves have become.
And there may be more coming.
Check out this second chart.
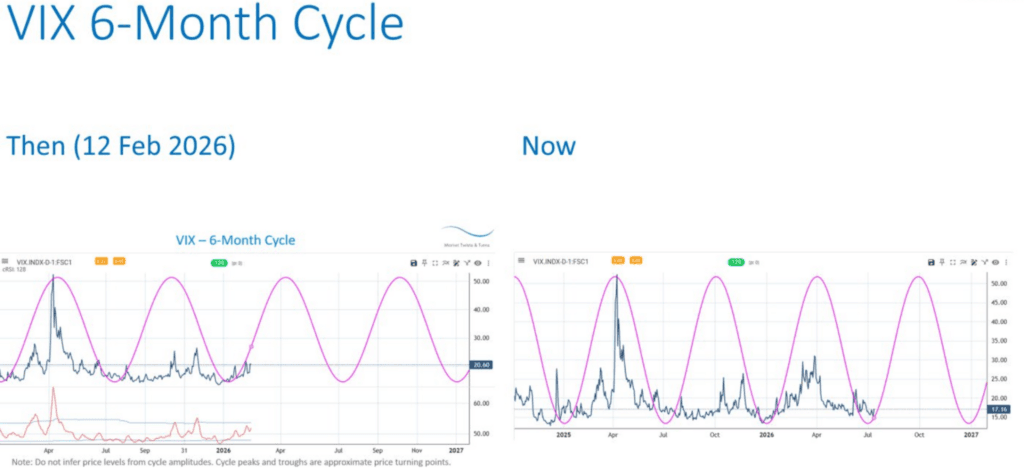
Source: @BravoCycles
It tracks a recurring six-month cycle in the VIX.
The timing is never exact, and no cycle works perfectly…
But it suggests broad market volatility may be near a low and preparing to turn higher again.
So we already have record dispersion between individual stocks…
At the same time the broader volatility cycle may be starting to wake up.
That’s a powerful combination.
And as I explain below, it could create some of the biggest opportunities of the year.
Insight of the Day
The next volatility wave may happen stock by stock.
Most traders hear “volatility” and assume the entire market has to fall.
Not in this kind of environment.
When correlation is this low, volatility can hit different stocks in completely different ways.
Just look at IBM yesterday.
The stock plunged 25% in a single session…
While the major indexes still moved higher.
That’s the kind of market we’re dealing with.
One stock can surge…
While another collapses.
One sector can break out…
While another quietly enters a bear market.
That also makes broad market calls much less useful.
You can be completely right about the S&P 500…
And still own the wrong stocks.
But this confusion also creates mispricing.
When investors disagree this much, some stocks get pushed far too low…
While others can explode higher as the market suddenly realizes it got the story wrong.
Those are the opportunities I’m looking for right now.
And later this afternoon at 3 p.m. Eastern…
I’m going LIVE to show you how to take advantage of the stock-by-stock volatility and confusion most traders are getting crushed by.
Using a unique “underground” technique that has led to moves like:
347% in eight days…
211% in three days…
Even 806% in just six days.
It’s the same type of technique billionaire hedge fund managers and Wall Street titans use to siphon millions out of the markets practically every single day.
But I’ve modified it so it’s well suited to traders working with smaller accounts.
So click here now to lock in your free seat if you haven’t already…
And I’ll see you at 3 p.m. ET today.
P.S. If you’re planning to attend on a mobile device, make sure you download the presentation app now so you don’t miss anything when it starts. See you there.
iOS: https://apps.apple.com/us/app/goto/id1465614785
Android: https://play.google.com/store/search?q=goto&c=apps
Customer Story of the Day
“Ross and the Traders Agency team are trustworthy.
I watched from the sidelines for several months, before joining. My wife was still skeptical after I signed up.
But now, after a month in, she sees the gains I am getting and she’s becoming much more optimistic.
This is important to me, because I have signed up for other services that didn’t work.
Ross’ strategy is the best (and most consistent) I have ever used.
I appreciate his straightforward approach to teaching. He’s clear and easy to understand.
I currently have The Insider Effect and Alpha Stocks. I am looking forward to the future, when I can also sign up for The Black Edge and Fire Traders.
Thank you Traders Agency for helping me and all the other “little guys” out there.”

Ross Givens
Editor, Stock Surge Daily
See more from Traders Agency on Google
Make us a preferred source and our market analysis will appear more prominently in your Google Search, Top Stories, and AI results.
Add to Preferred Sources