Russell 2000. Next 600 tick. Potential move.
Hey, everyone. I hope you enjoy this content. Don’t forget to click that subscribe button and hit that bell to be notified of upcoming videos.
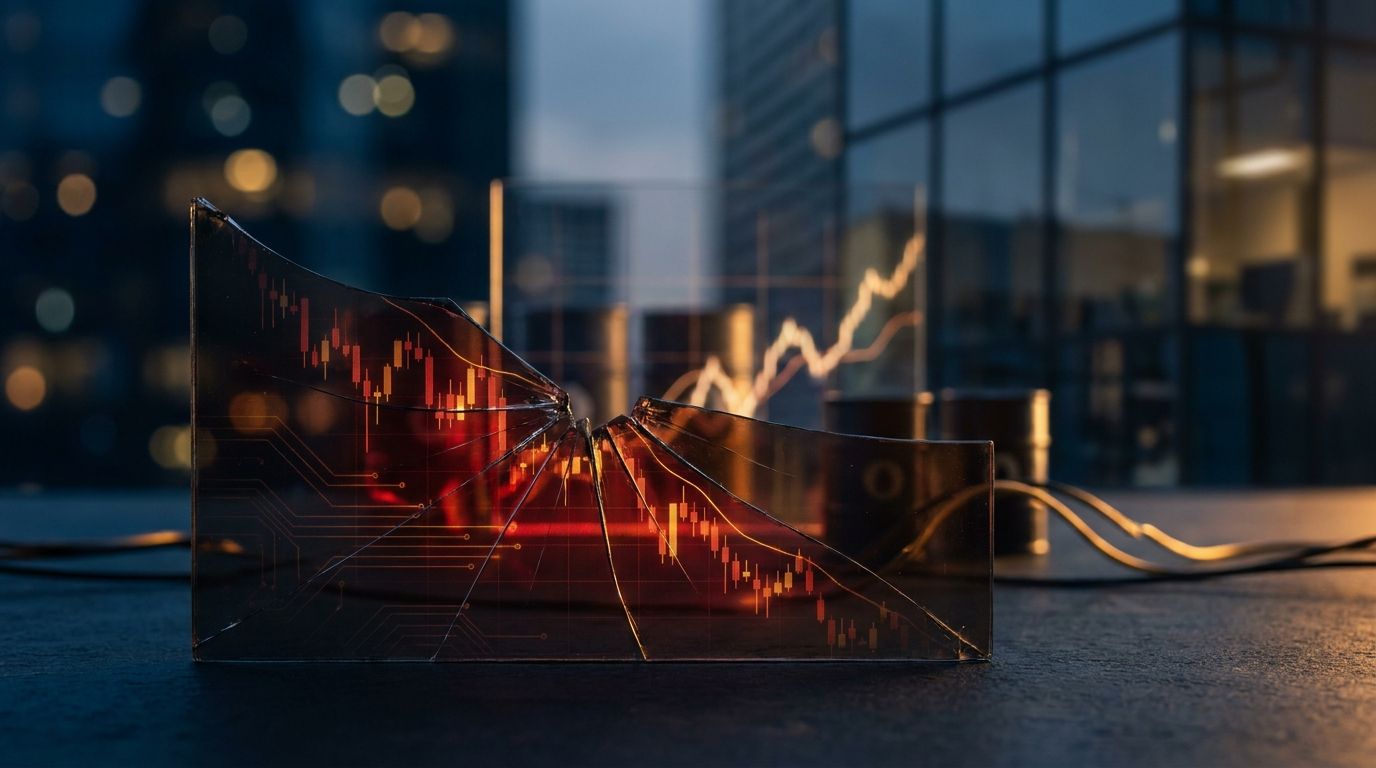
Hey everyone, Josh Martinez here with tradersagency.com, and welcome to this week’s idea. Today’s date is August 16th, 2021. Happy Monday, everybody. Behind me is the E-mini Russell 2000, and just like last week, how we had the NASDAQ 100 at the bottom of the channel, now we have the Russell 2000 at the bottom of the channel. The question is going to be, are we going to trade the pattern or are we going to ignore the pattern? Let’s see what the research says. Currently we have an UpChannel winner. If the mark comes to the bottom blue level, we look for the overall reversal to the top level. What’s neat about this is these movements are about 600 ticks of upward movement.

As we know, trading with an E-mini contract, every ticks worth about $5. There’s a $3000 buying opportunity, $3000 buying opportunity, $3000 buying opportunity. When trading an E-mini contract, we trade a micro contract, which is 1/10 the average investment of the E-mini, which means 1/10 the average risk, 1/10 the average reward. Your micros will provide still a $300 opportunity. Now we zoom in. When we take a look at what’s going on, one of the things that we’re starting to see is we’re starting to see a very, very decisional full body candlesticks. That’s a good thing because normally what ends up happening is when the market makes a decisional movement, we get these full body candlesticks, and then we get the follow-through. If we take a look at the previous candlesticks, you can see it’s pretty normal because the indecision, indecision, indecision, indecision, decision down, then decision up.
Right When that decision candlestick formed, we had our follow-through. Even here, indecision, then decision, a little bit of full through. Even over here, indecision, indecision, decision, follow through. These decisional candlesticks can be leading indicators. Now, the other thing that we can do is you can also bring in a countertrend line, try to match that angle, the mark close above the angle. Just lets you know that we are closing at the market. Continue up, we close above the angle that’s pushing the market down. Let me just draw it out for you. Normally what ends up happening is, in a channel you have a bottom support level, you have a height of resistance. You have market waves on the way up, and then it waves on the way down, then consolidates and the waves on the way up. So on and so forth.

The challenge is if you buy the market too early, if you buy the market right when it touches the bottom of U-turn, you can get stuck in these consolidation ranges. Not a whole lot of fun. We bring in the countertrend line, which literally just counters the angle. You see these little highs, high there, high there, high there. We bring in an angle that counters the resistance level, or where the market forms equal highs, and when or if we close above it, the market usually rallies. Here is another example. Market comes down, lower lows, lower highs, and instead of buying the low, just because it’s low, you bring in the counter trend line, you find the angle that’s pushing the market down. When or if the market closes above that angle, this is where you want to buy, and then usually you take the ride up towards the north.

Once again, buy low, profit high, buy low profit high. You can buy in at these countertrend lines and normally enter in and have the market go your way right away. If you bring in a countertrend line, you see we’re right on it now. If we can continue to rally increase and we close above that angle, good chance that you’re going to get a follow-through. Stop placements, I like to place stops below the previous low U-turn. Stops are going to definitely be below. This level would probably be low. The previous lows as well. This way makes sure that stops are out of the way of the wave. If everything goes to plan, which hopefully it does, who knows, we’ll have a 600 tick rally. That’s this week’s idea. We’ll see you next week.
Hey guys, if enjoyed this video and you want to stay up to date to my weekly content, go ahead and subscribe to this channel, tradersagency.com. If you want to be notified every time I post a video, go ahead and click on that bell down below. If you want even more information, don’t forget to visit my website at tradersagency.com and subscribe to my free weekly newsletter where I send out my research on market opportunities. Thank you for the opportunity. Have a wonderful day.
See more from Traders Agency on Google
Make us a preferred source and our market analysis will appear more prominently in your Google Search, Top Stories, and AI results.
Add to Preferred Sources