There’s a lot of understandable worry out there.
So let’s look at some data on the longevity of past bull markets.
Chart of the Day
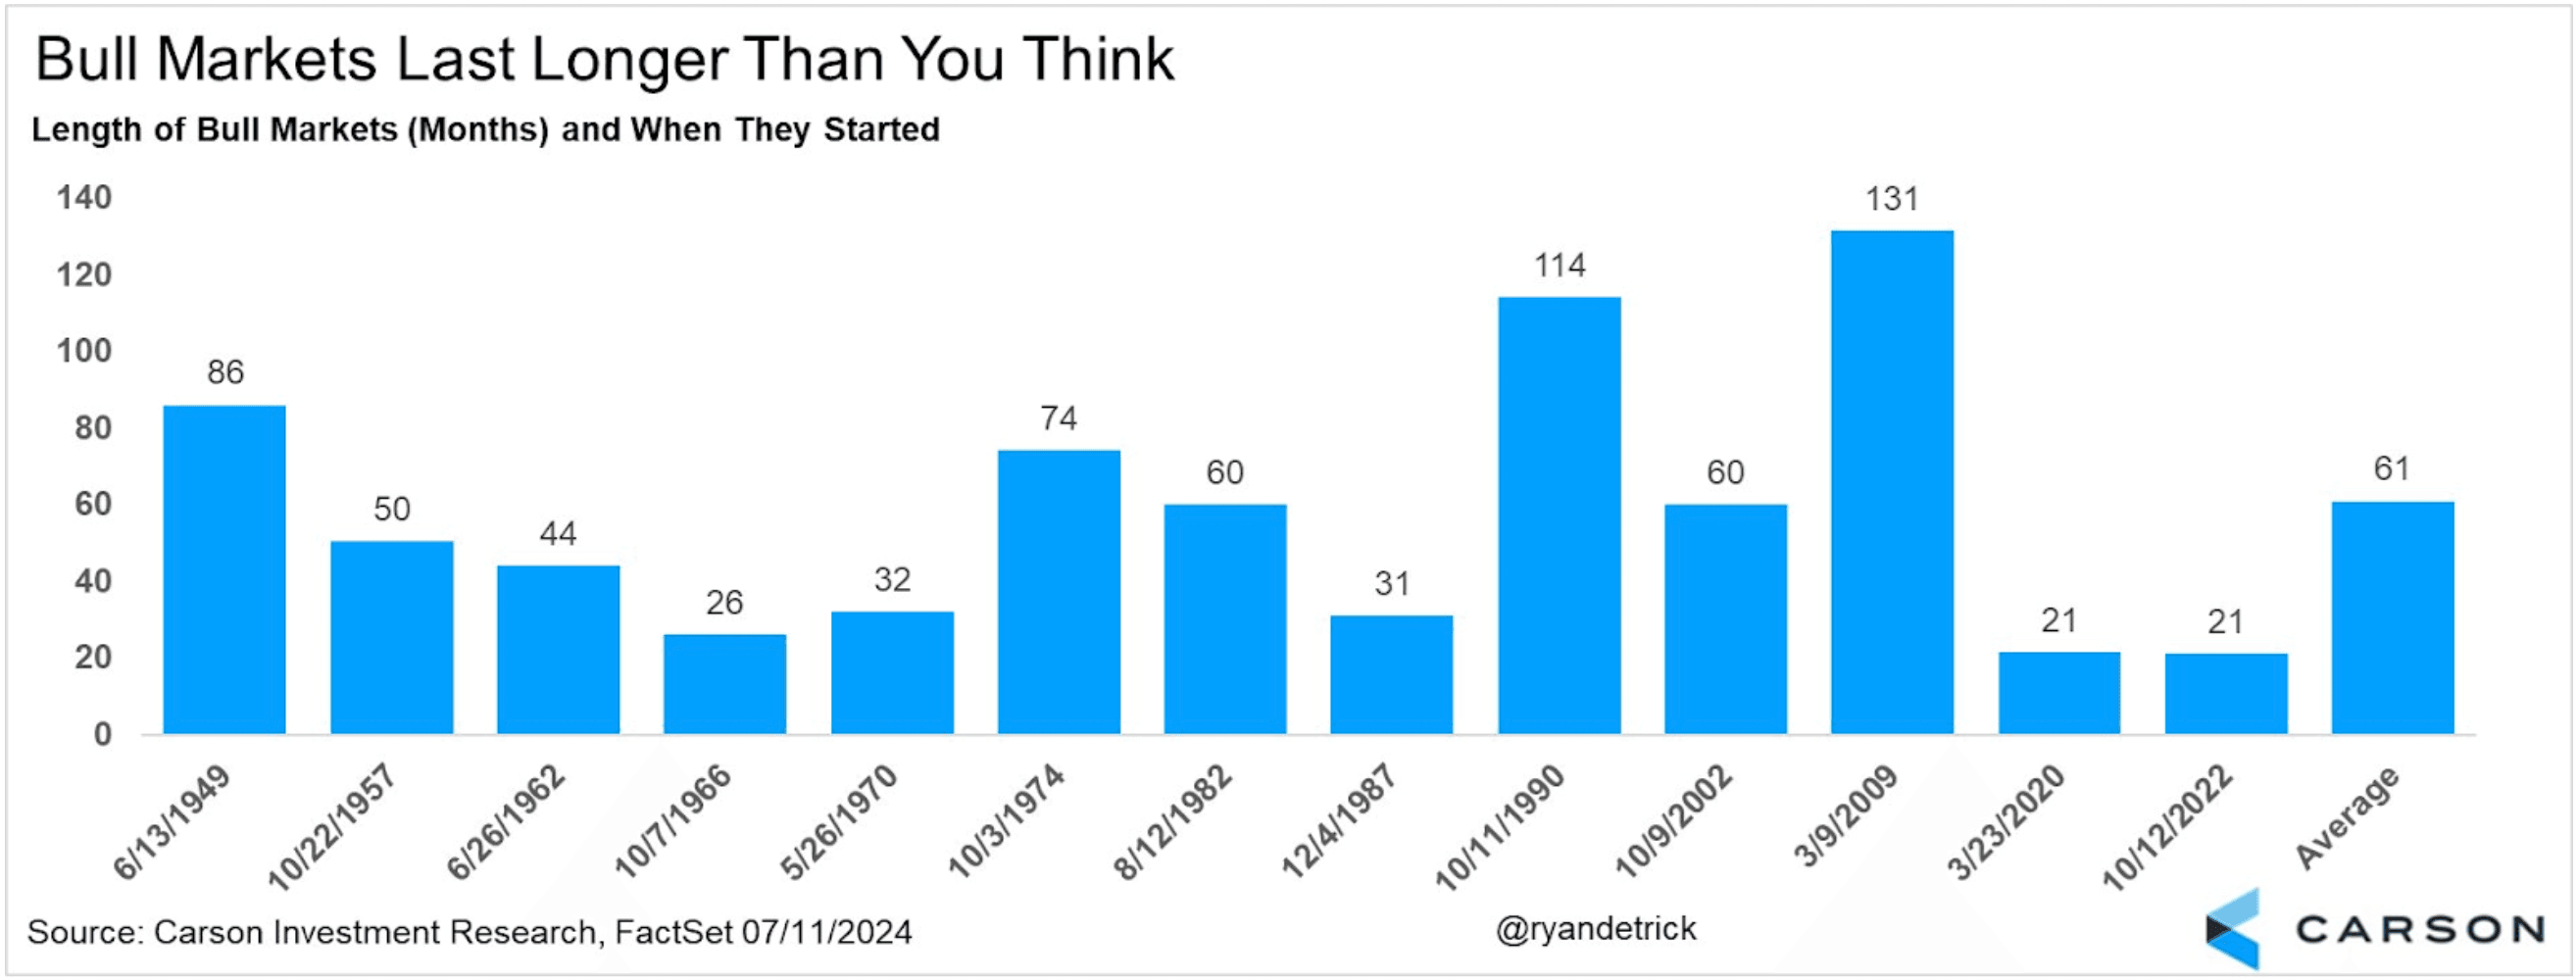
This chart shows just how long past bull markets have lasted.
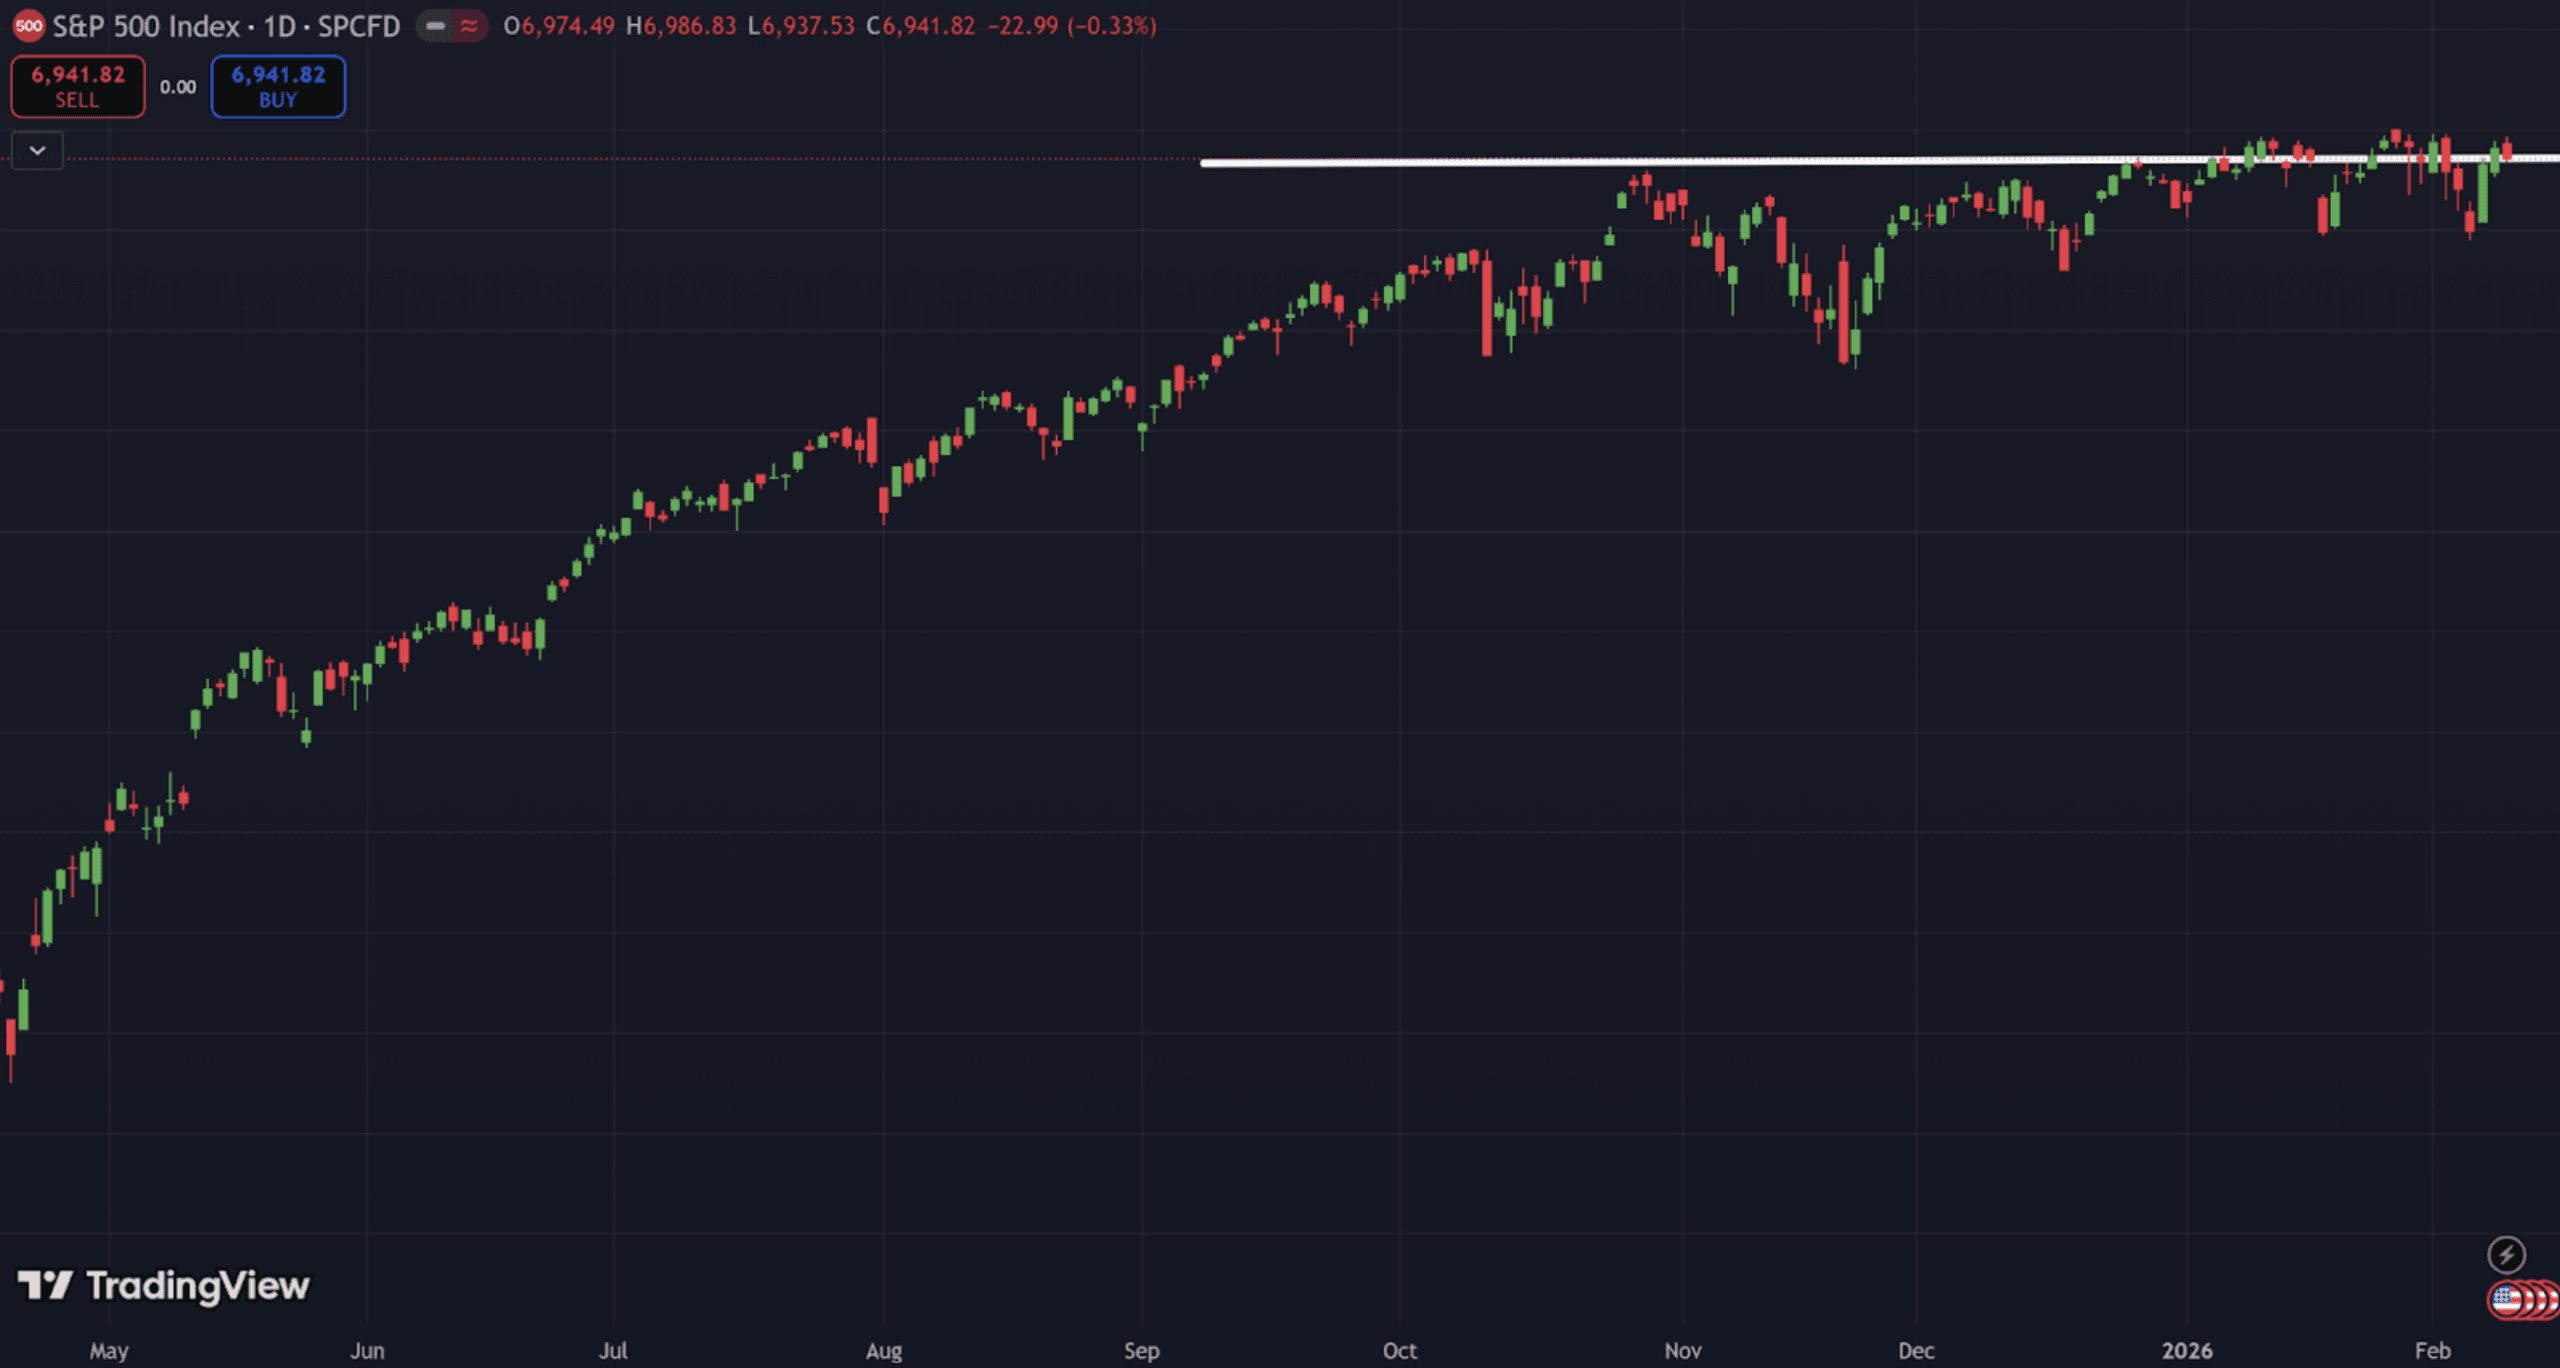
For context, the bull market we’re currently in is 21 months old.
The average bull market lasts 61 months.
Yes, the 2020 bull market only lasted 21 months, but that was also the shortest bull market in history.
Now, I’d like to remind you that there’s no such thing as guarantees in the market.
But if we take an objective look at the data, it tells us that the odds are this bull market will be here for quite a while longer.
I explain some key drivers in the Insight of the Day below.
Insight of the Day
Two big factors have yet to come into play – rate cuts and “cash on the sidelines”
Here are two big factors that could keep supporting this bull market for many months more.
The first is, of course, the Fed cutting rates (Powell just spoke yesterday about the risks of keeping rates high for too long – and look at how positively the markets reacted).
The second is the cash still parked in money market funds – now having hit a new record high of $6.15 trillion.
As long as corporate earnings remain robust (which they have been so far), these factors could keep this bull market going for years more.
They’re also interconnected.
When the Fed cuts rates, a lot of that cash could come off the sidelines and flow into the market.
Because we keep seeing new all-time highs in the market, we tend to underestimate just how much cash is still left on the sidelines.
In fact, many traders underestimate just how many buyers are still pouring into the market – and it’s causing them to miss out on the opportunities right under their noses.
The question is – how can we find out where all these buyers are going?
That’s why tomorrow morning at 11 a.m. Eastern…
I’m going LIVE for a new masterclass that will show you to spot exactly where the market’s biggest buyers are heading…
So you can position yourself to take advantage of their capital.
The key is a unique indicator I developed that detects when buying pressure is building up in a stock.
After you attend this masterclass tomorrow, you’ll know:
- How to detect when buying pressure is building up in a specific stock…
- Why most traders are blind to this buildup of pressure (causing them to miss out on big gains)...
- And how to use my “PSI Gauge” to determine the exact point to jump into one of these “pressurized” stocks for maximum gains.
So make sure you click here to save your seat for my live masterclass tomorrow…
And watch out for the login info in your inbox tomorrow morning.

Ross Givens
Editor, Stock Surge Daily
See more from Traders Agency on Google
Make us a preferred source and our market analysis will appear more prominently in your Google Search, Top Stories, and AI results.
Add to Preferred Sources