Amazon.com, Inc.
Amazon.com, Inc. (AMZN) is the ubiquitous online retailer offering customers nearly anything they could ever want delivered straight to their doors.
The company also runs its lucrative Amazon Web Services (AWS) platform focused on cloud computing services.
Here’s how the chart is setting up:
 -- Source: TradingView")
And here’s how the stock is setting up with my Stock Surge Indicator (SSI):
- Surge score: 70/100
- % Above 52-wk low: 25.4%
- MFI reading: 61
- Sales growth: +15%
- Triple momentum: yes
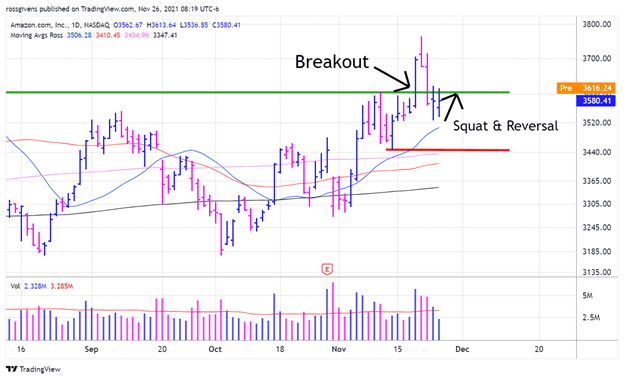
AMZN tried to break out last week but failed to follow through. It squatted back to the resistance level but quickly reversed back to the upside.
Renewed COVID fears have this stock up on Friday while most of the market is down.
A short-term pop in work-from-home stocks is expected, and AMZN is a good way to play it.
Traders now have the chance to buy AMZN near the original buy zone and work a tight stop to risk less than 5% on the trade.
The Real Brokerage Inc.
The Real Brokerage Inc. (REAX) is a $650 million real estate brokerage company based in Canada but with operations in the United States as well.
Here’s how the chart is setting up:
 -- Source: TradingView")
And here’s how the stock is setting up with my SSI:
- Surge score: 96/100
- % Above 52-wk low: 421%
- MFI reading: 87
- Sales growth: +885%
- Triple momentum: yes
REAX formed a high tight flag pattern and quickly emerged to new highs after only six trading days.
The company is experiencing parabolic growth, and investors clearly have a big appetite for this stock.
As long as price does not get extended, the stock is buyable with a stop at $3.23.
Albertsons Companies, Inc.
Albertsons Companies, Inc. (ACI) is the $16 billion food and drug store operator, with 2,277 stores and 1,727 pharmacies along with in-store branded coffee shops and adjacent fuel centers.
Here’s how the chart is setting up:
 -- Source: TradingView")
And here’s how the stock is setting up with my SSI:
- Surge score: 97/100
- % Above 52-wk low: 144%
- MFI reading: 42
- Sales growth: +5%
- Triple momentum: yes
I typically like to see higher sales growth than what Albertsons posted last quarter.
However, the company beat estimates in each of the last three quarters, and analysts are slowly raising their projections for the company.
Plus, the stock is actually up Friday morning in an ugly market.
We have a textbook consolidation pattern with pullbacks compressing down to a nice and tight 6%.
I would be comfortable buying here with a stop beneath the swing low.
See more from Traders Agency on Google
Make us a preferred source and our market analysis will appear more prominently in your Google Search, Top Stories, and AI results.
Add to Preferred Sources