Let’s start the day with an interesting chart about crude oil and Treasury yields – and what that could mean for the stock market.
Chart of the Day
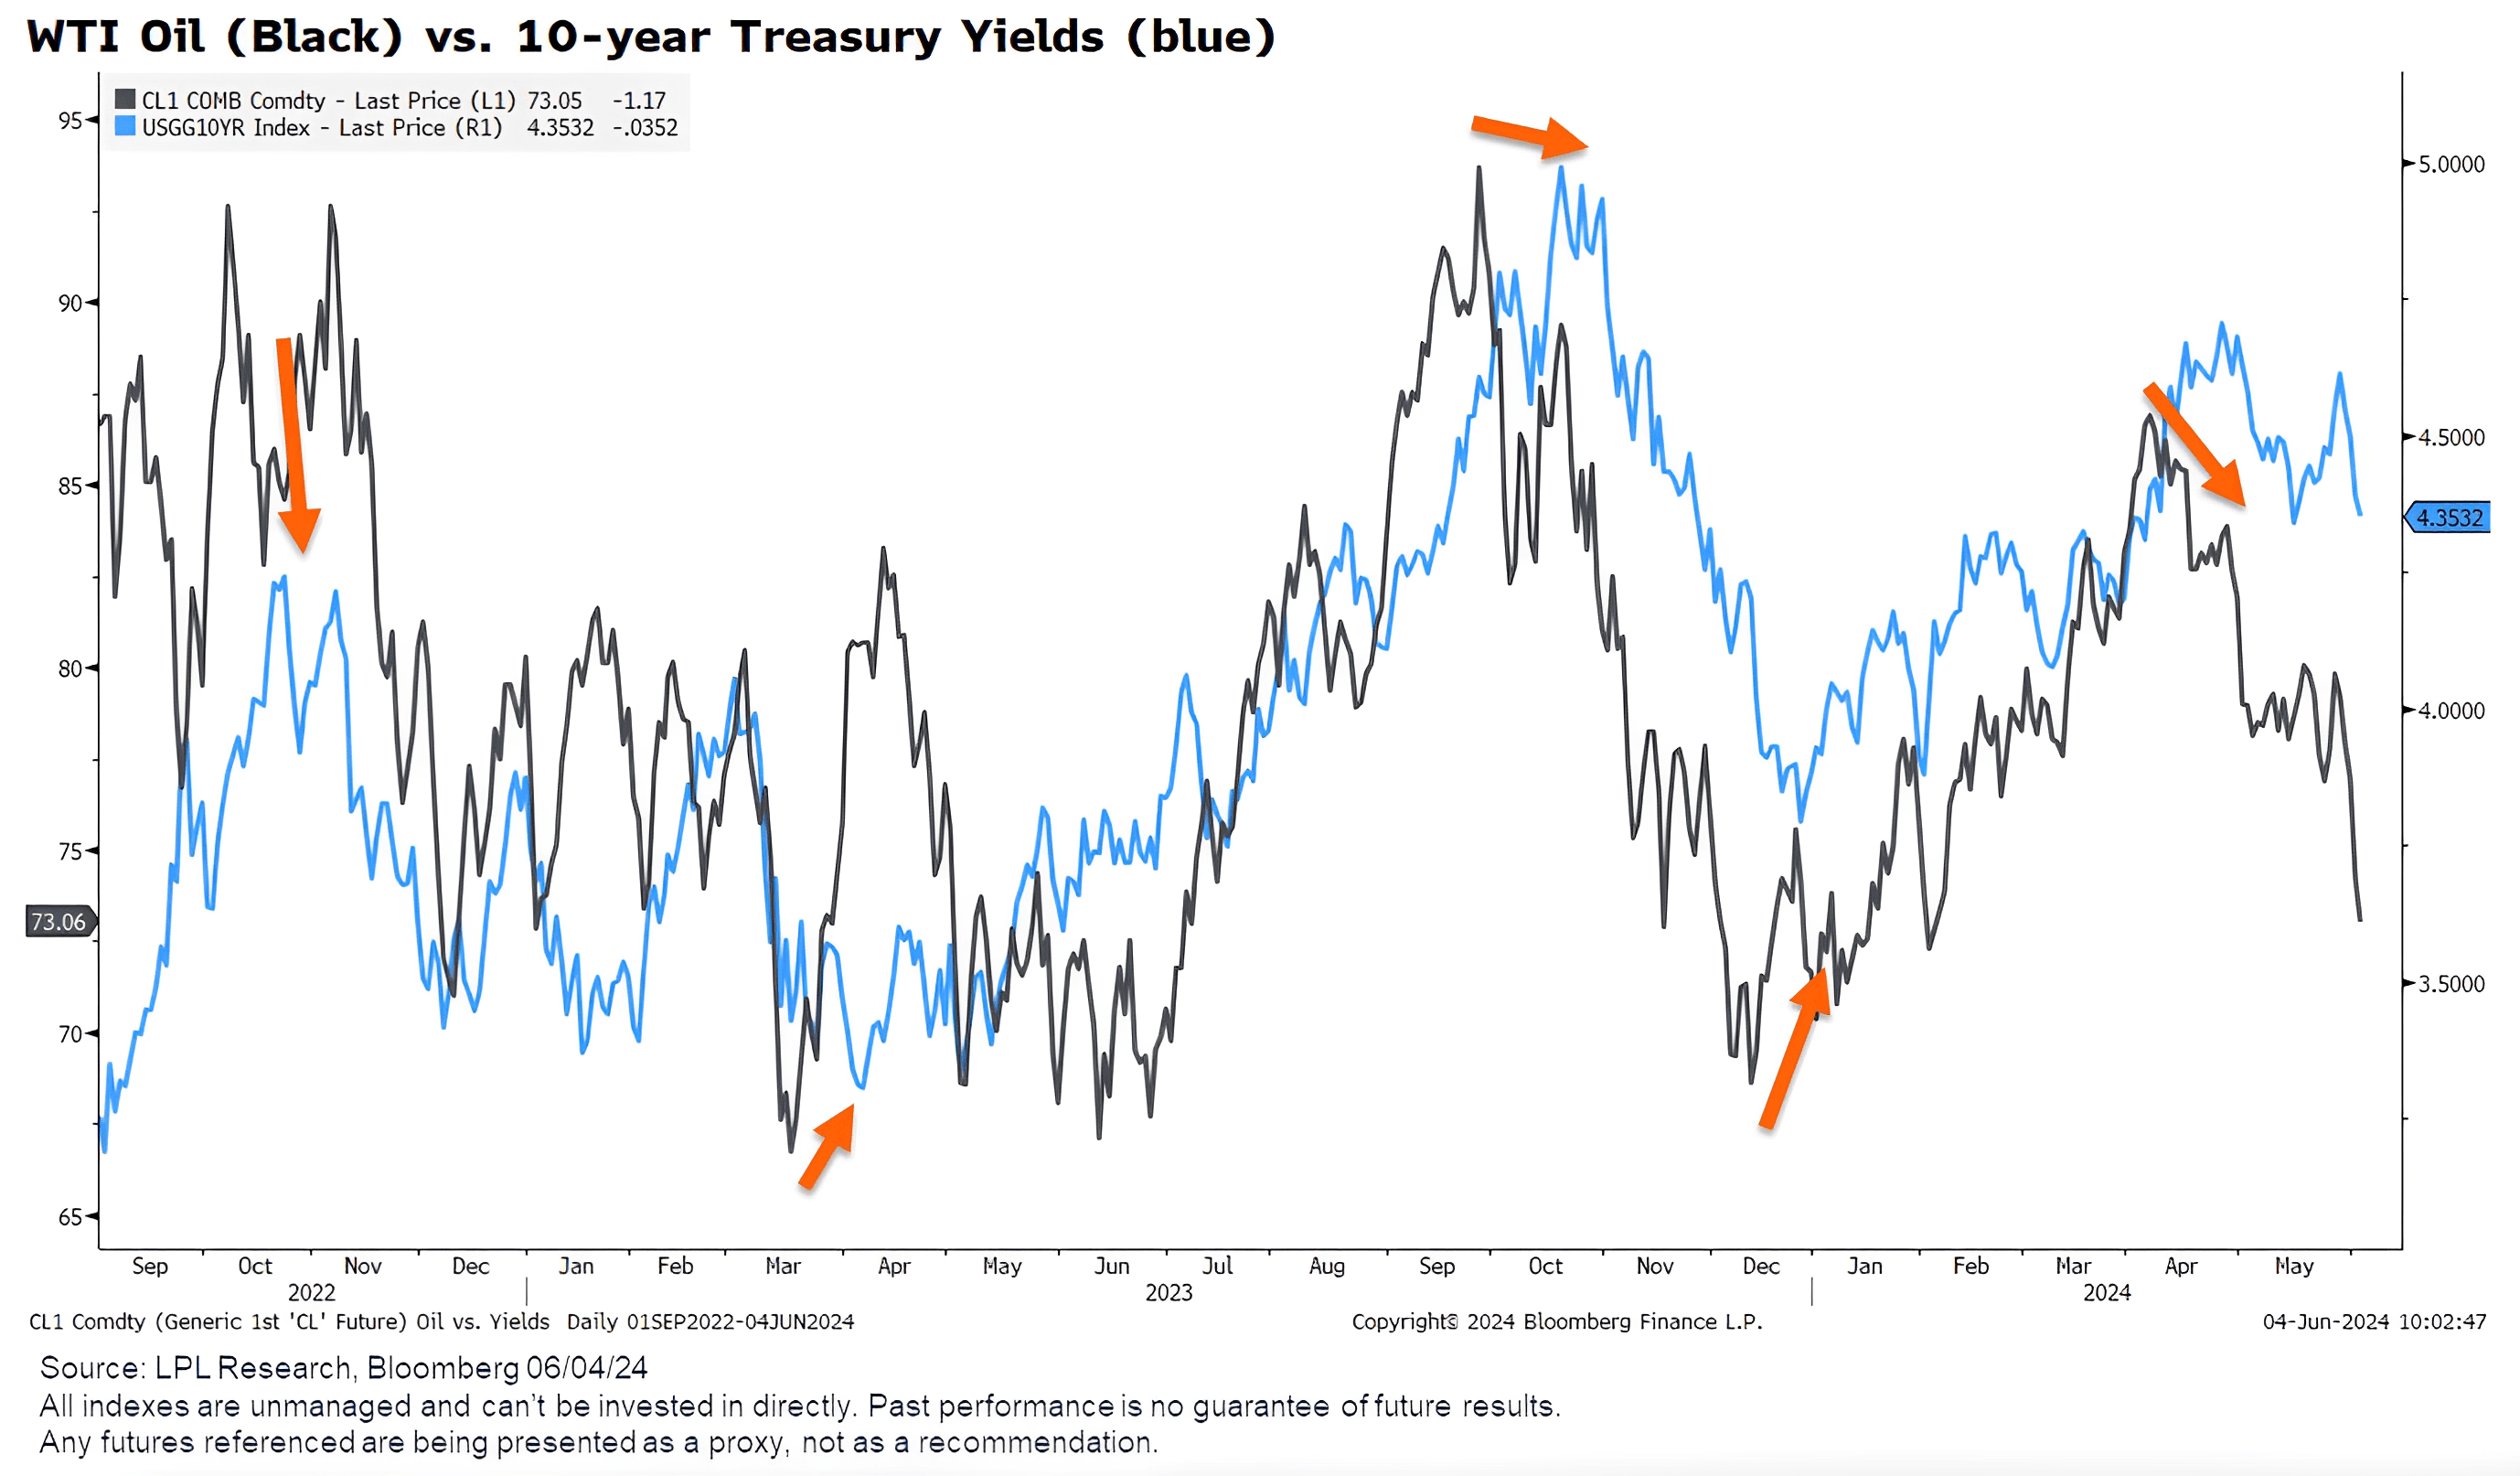
This chart shows the correlations between the price of crude oil and the US 10-year Treasury yield.
As the chart shows, they’re both very strongly correlated…
And right now, the price of crude oil has been dipping heavily – meaning the yields are likely to follow.
And since the yields are inversely correlated to stocks, that means falling yields are most likely to lead to rising stocks.
This is something we can take advantage of.
Insight of the Day
A rising tide lifts all boats – just not equally.
As I said yesterday, we’re also seeing a sector rotation happening inside the market.
Combine this with the positive effect of falling yields, and we could likely see the leading sectors – and the leading stocks within these sectors – take flight.
That’s where we want to be positioned – because betting on strength is a high-percentage recipe for consistent success.
And that’s why later today at 3 p.m. Eastern…
I’m going LIVE for a masterclass that will allow you to position yourself in the leading stocks in the leading sectors…
So you can take unequal advantage of the rising market.
My top tool for doing this is my favorite chart pattern of all time (and a favorite of many of the world’s greatest traders as well).
This chart pattern is perfect for times like this, when the market is rising and rotating simultaneously.
So, if you haven’t already, make sure you click here to guarantee your spot for my live masterclass later, where I’ll reveal:
- Exactly what this chart pattern looks like…
- The statistics of its incredible performance in both bull and bear markets…
- And how to precisely position yourself within this pattern to set yourself up for the biggest gains.
Understanding this chart pattern will open your eyes to all the opportunities out there, so don’t miss it.
My team will send you the login info before the masterclass starts.
See you later today at 3 p.m. ET.

Ross Givens
Editor, Stock Surge Daily
See more from Traders Agency on Google
Make us a preferred source and our market analysis will appear more prominently in your Google Search, Top Stories, and AI results.
Add to Preferred Sources