It’s the first trading day of a new month.
Let’s see how the market has done in June.
Chart of the Day
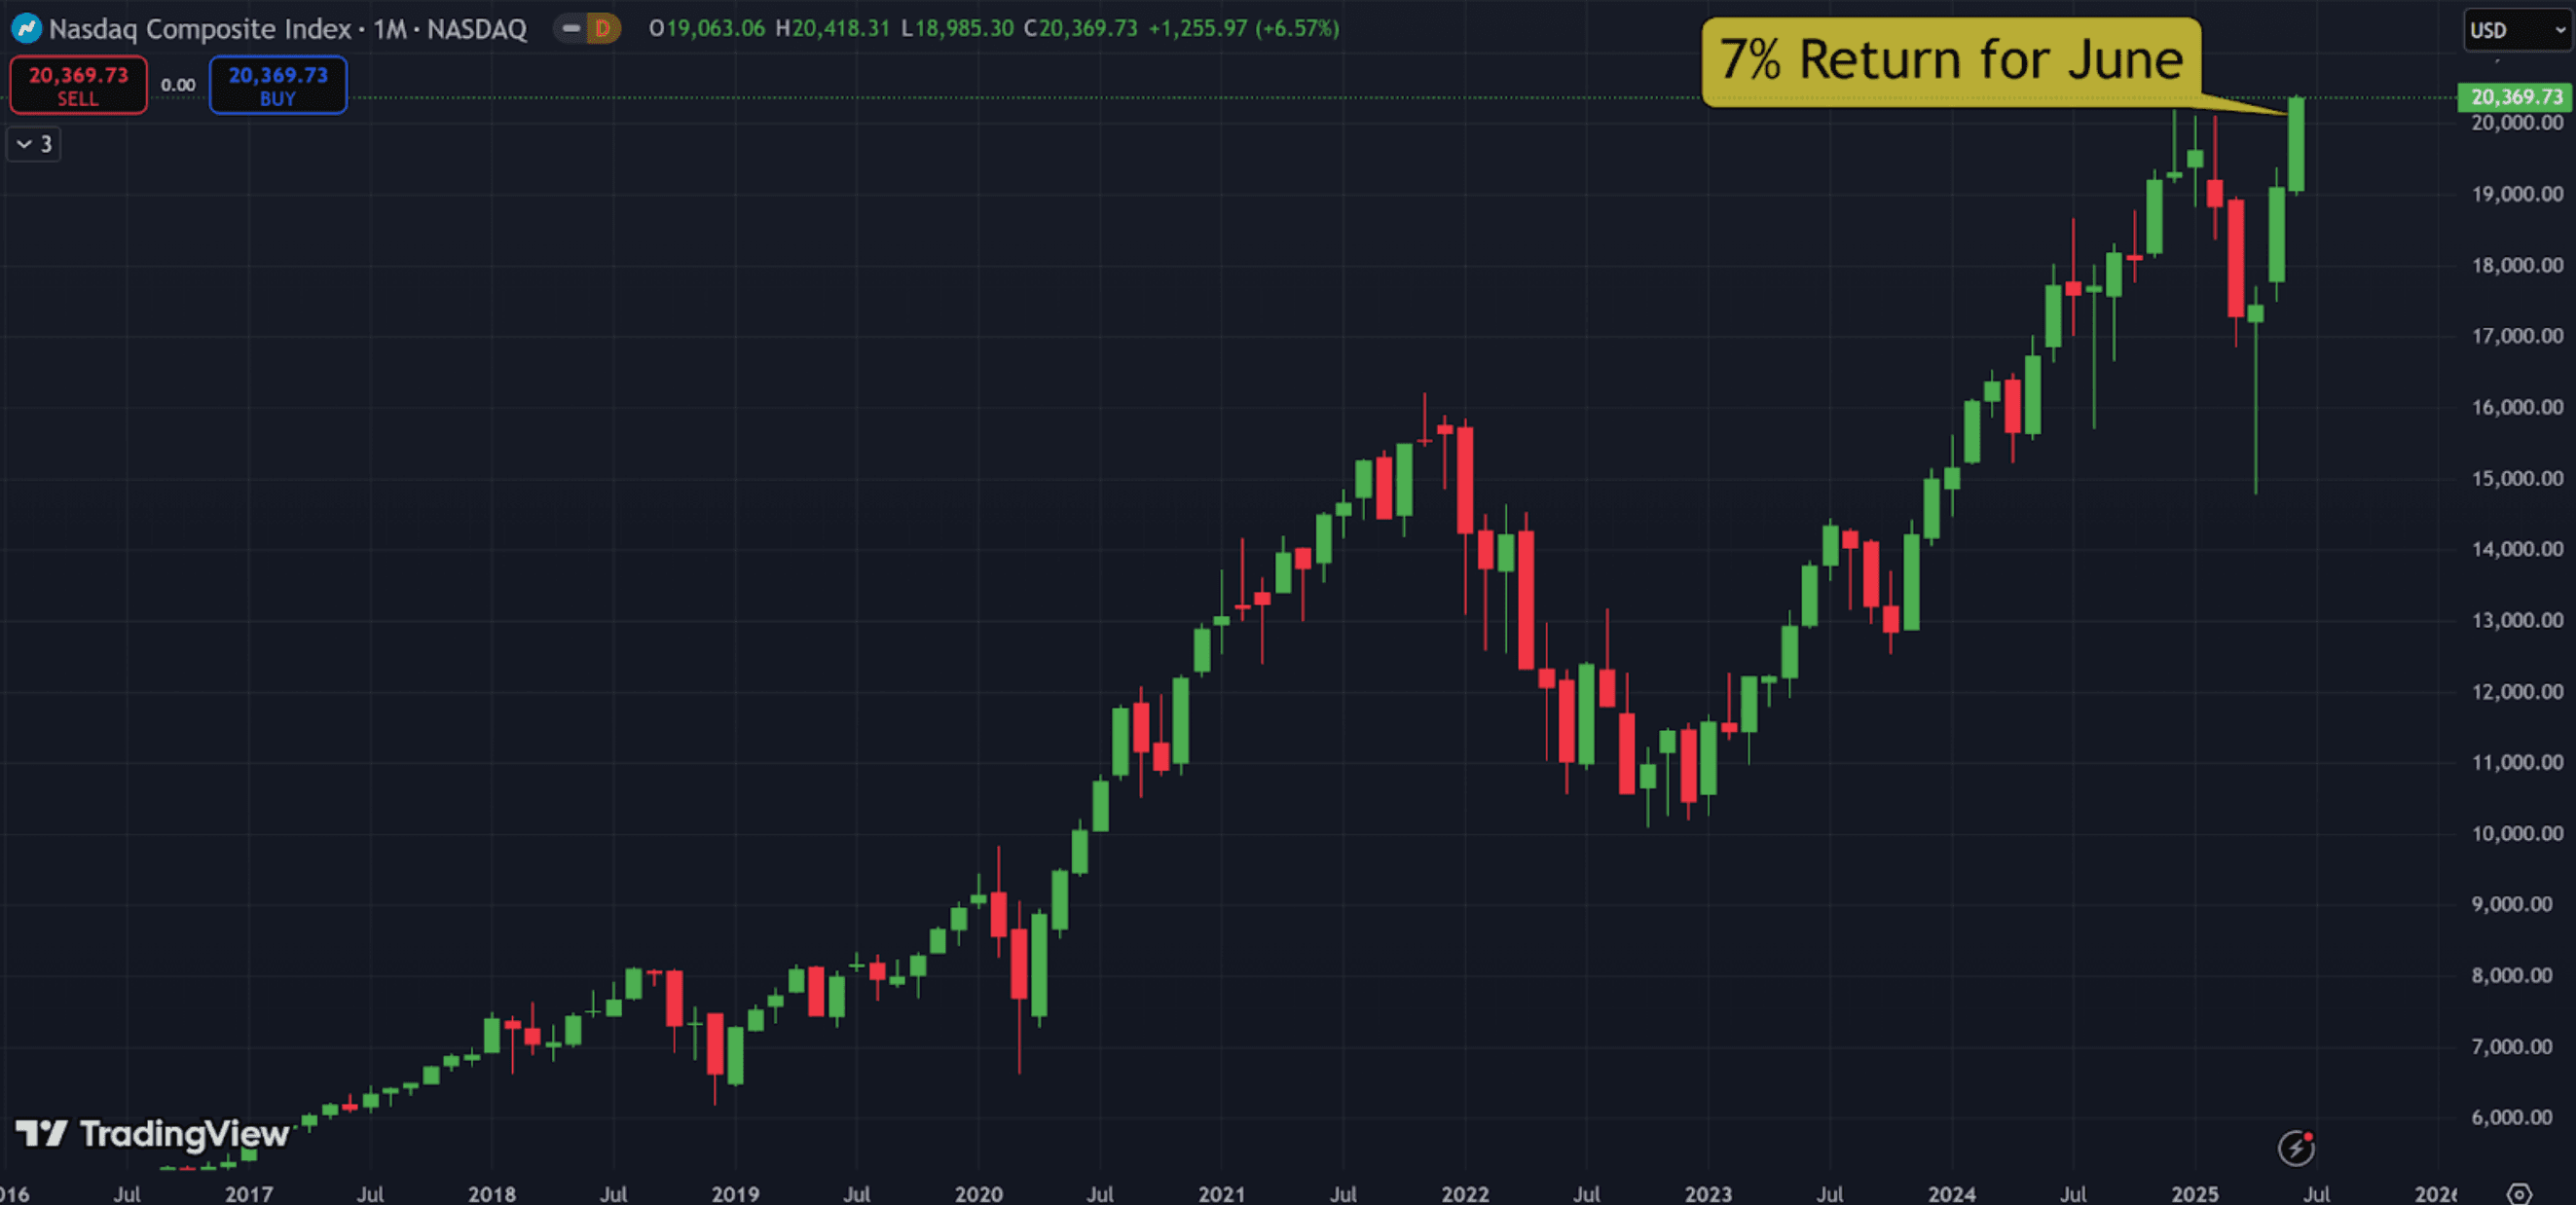
This is the monthly chart for the Nasdaq – which notched a 6.9% return for the month.
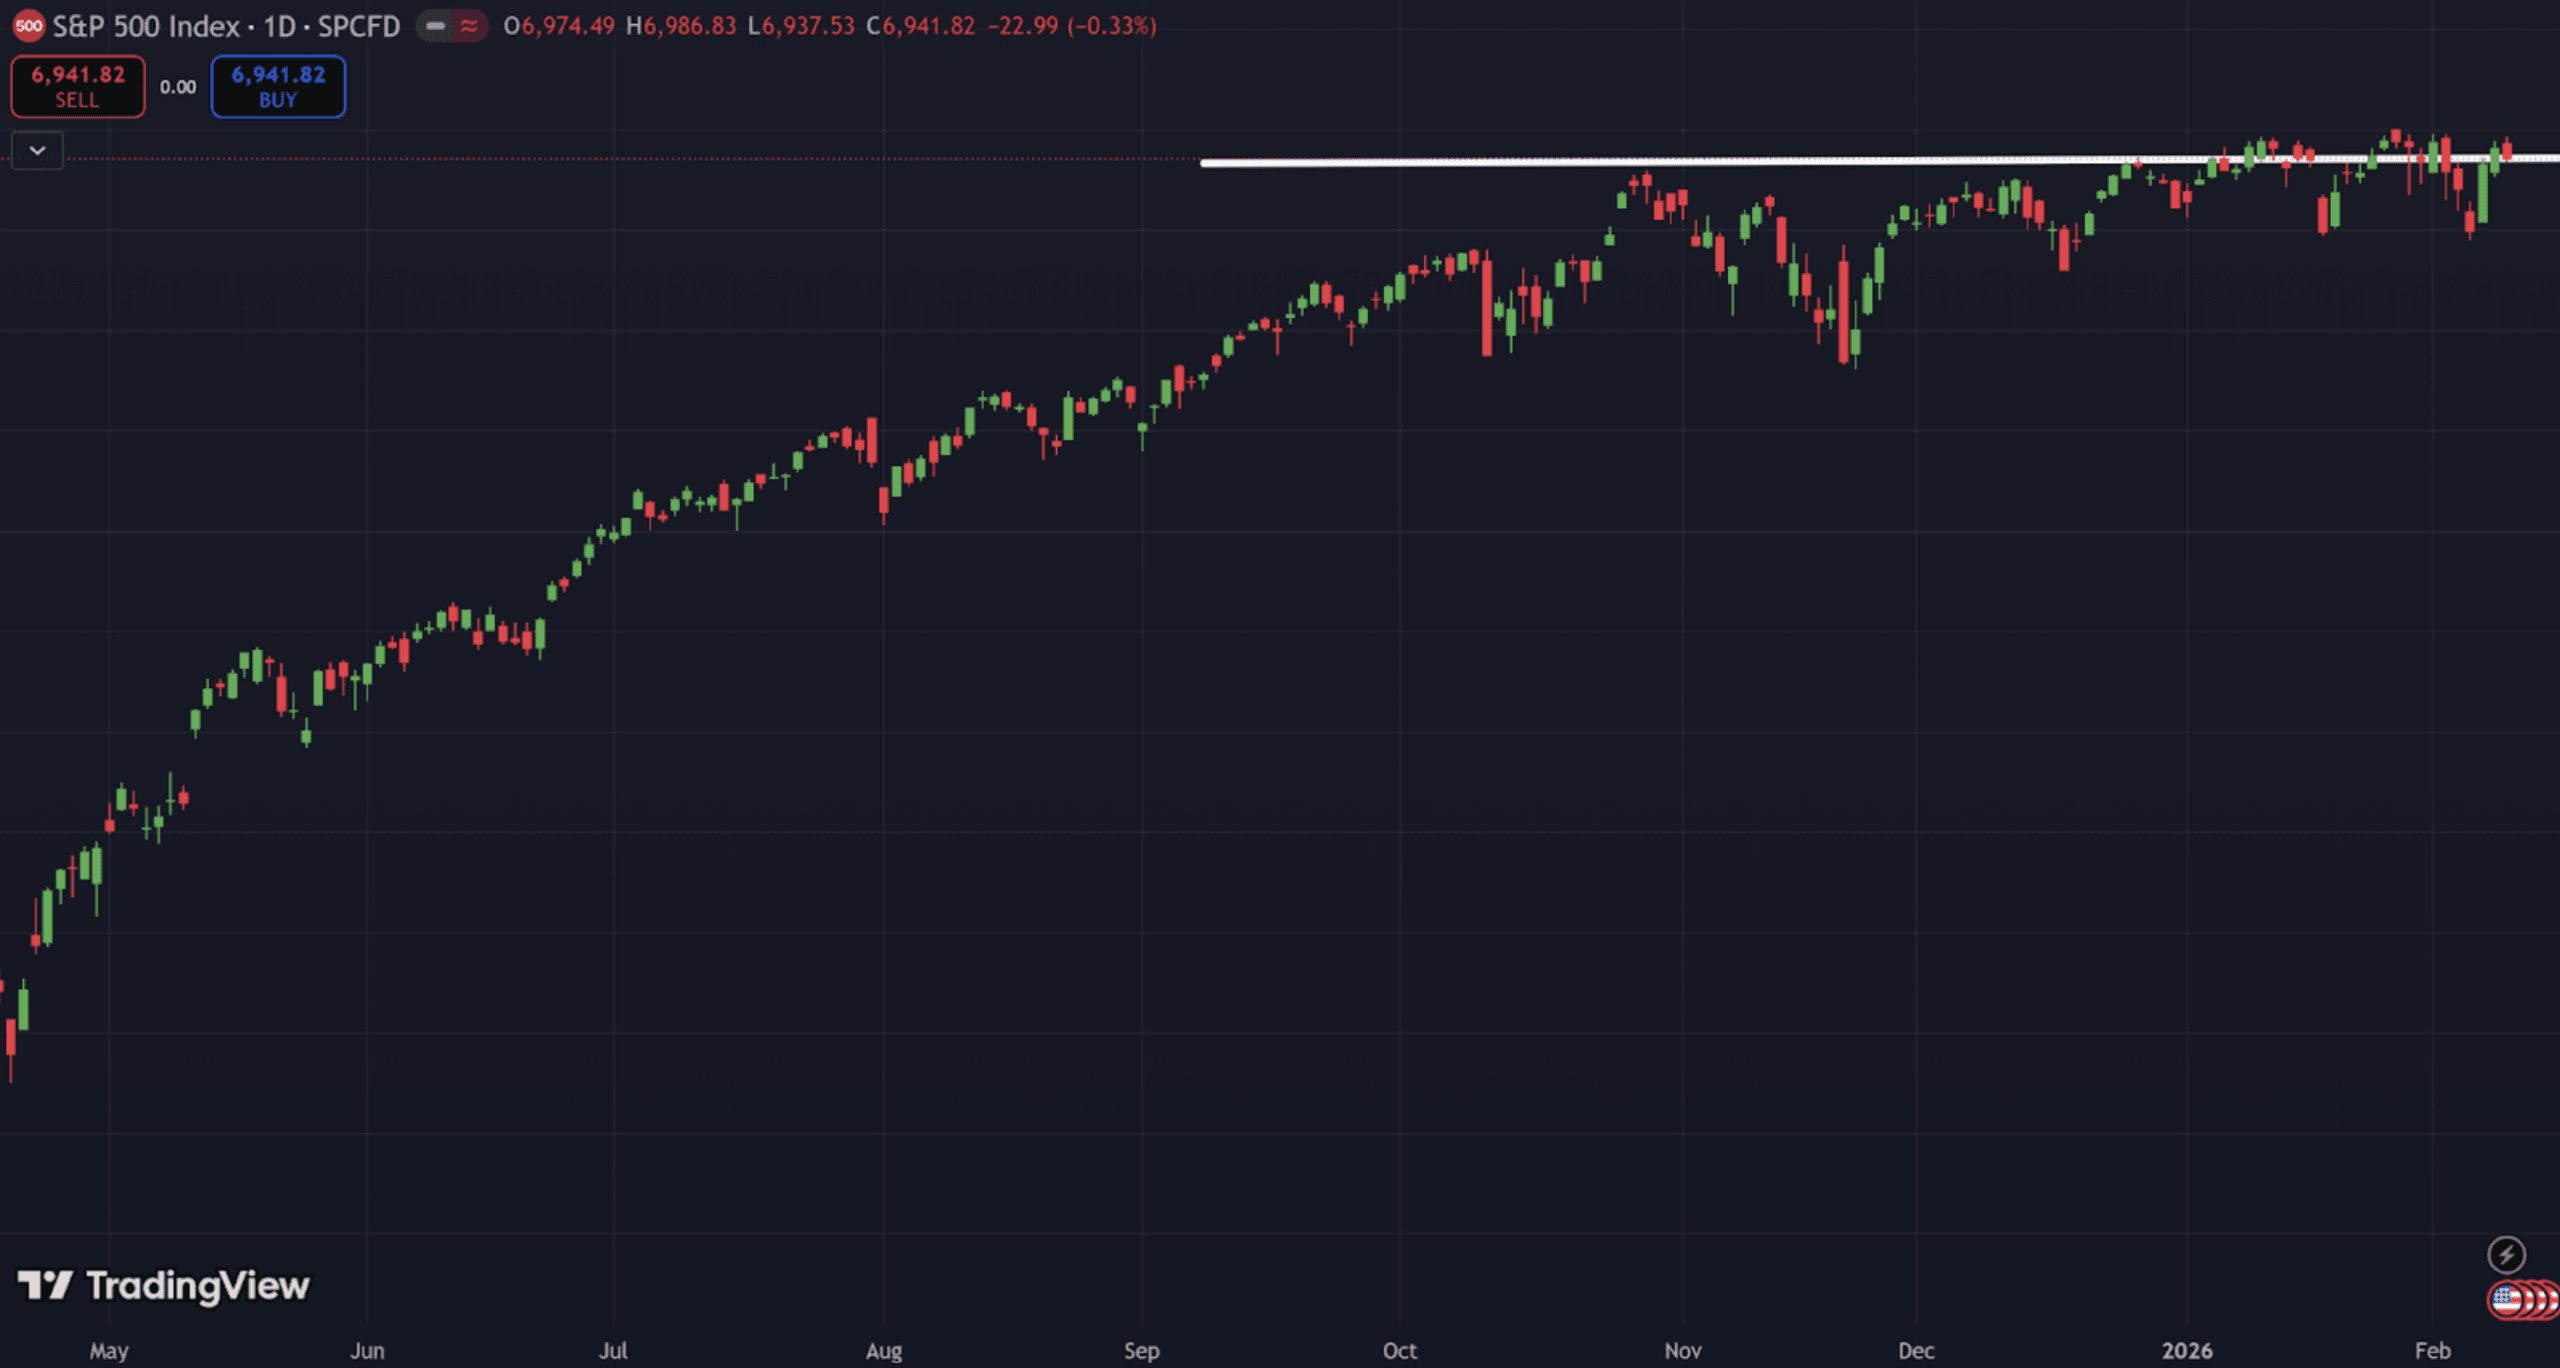
The S&P 500 came in at 5.3%, another impressive performance.
This was the second straight month of strong gains – a sign of powerful follow through.
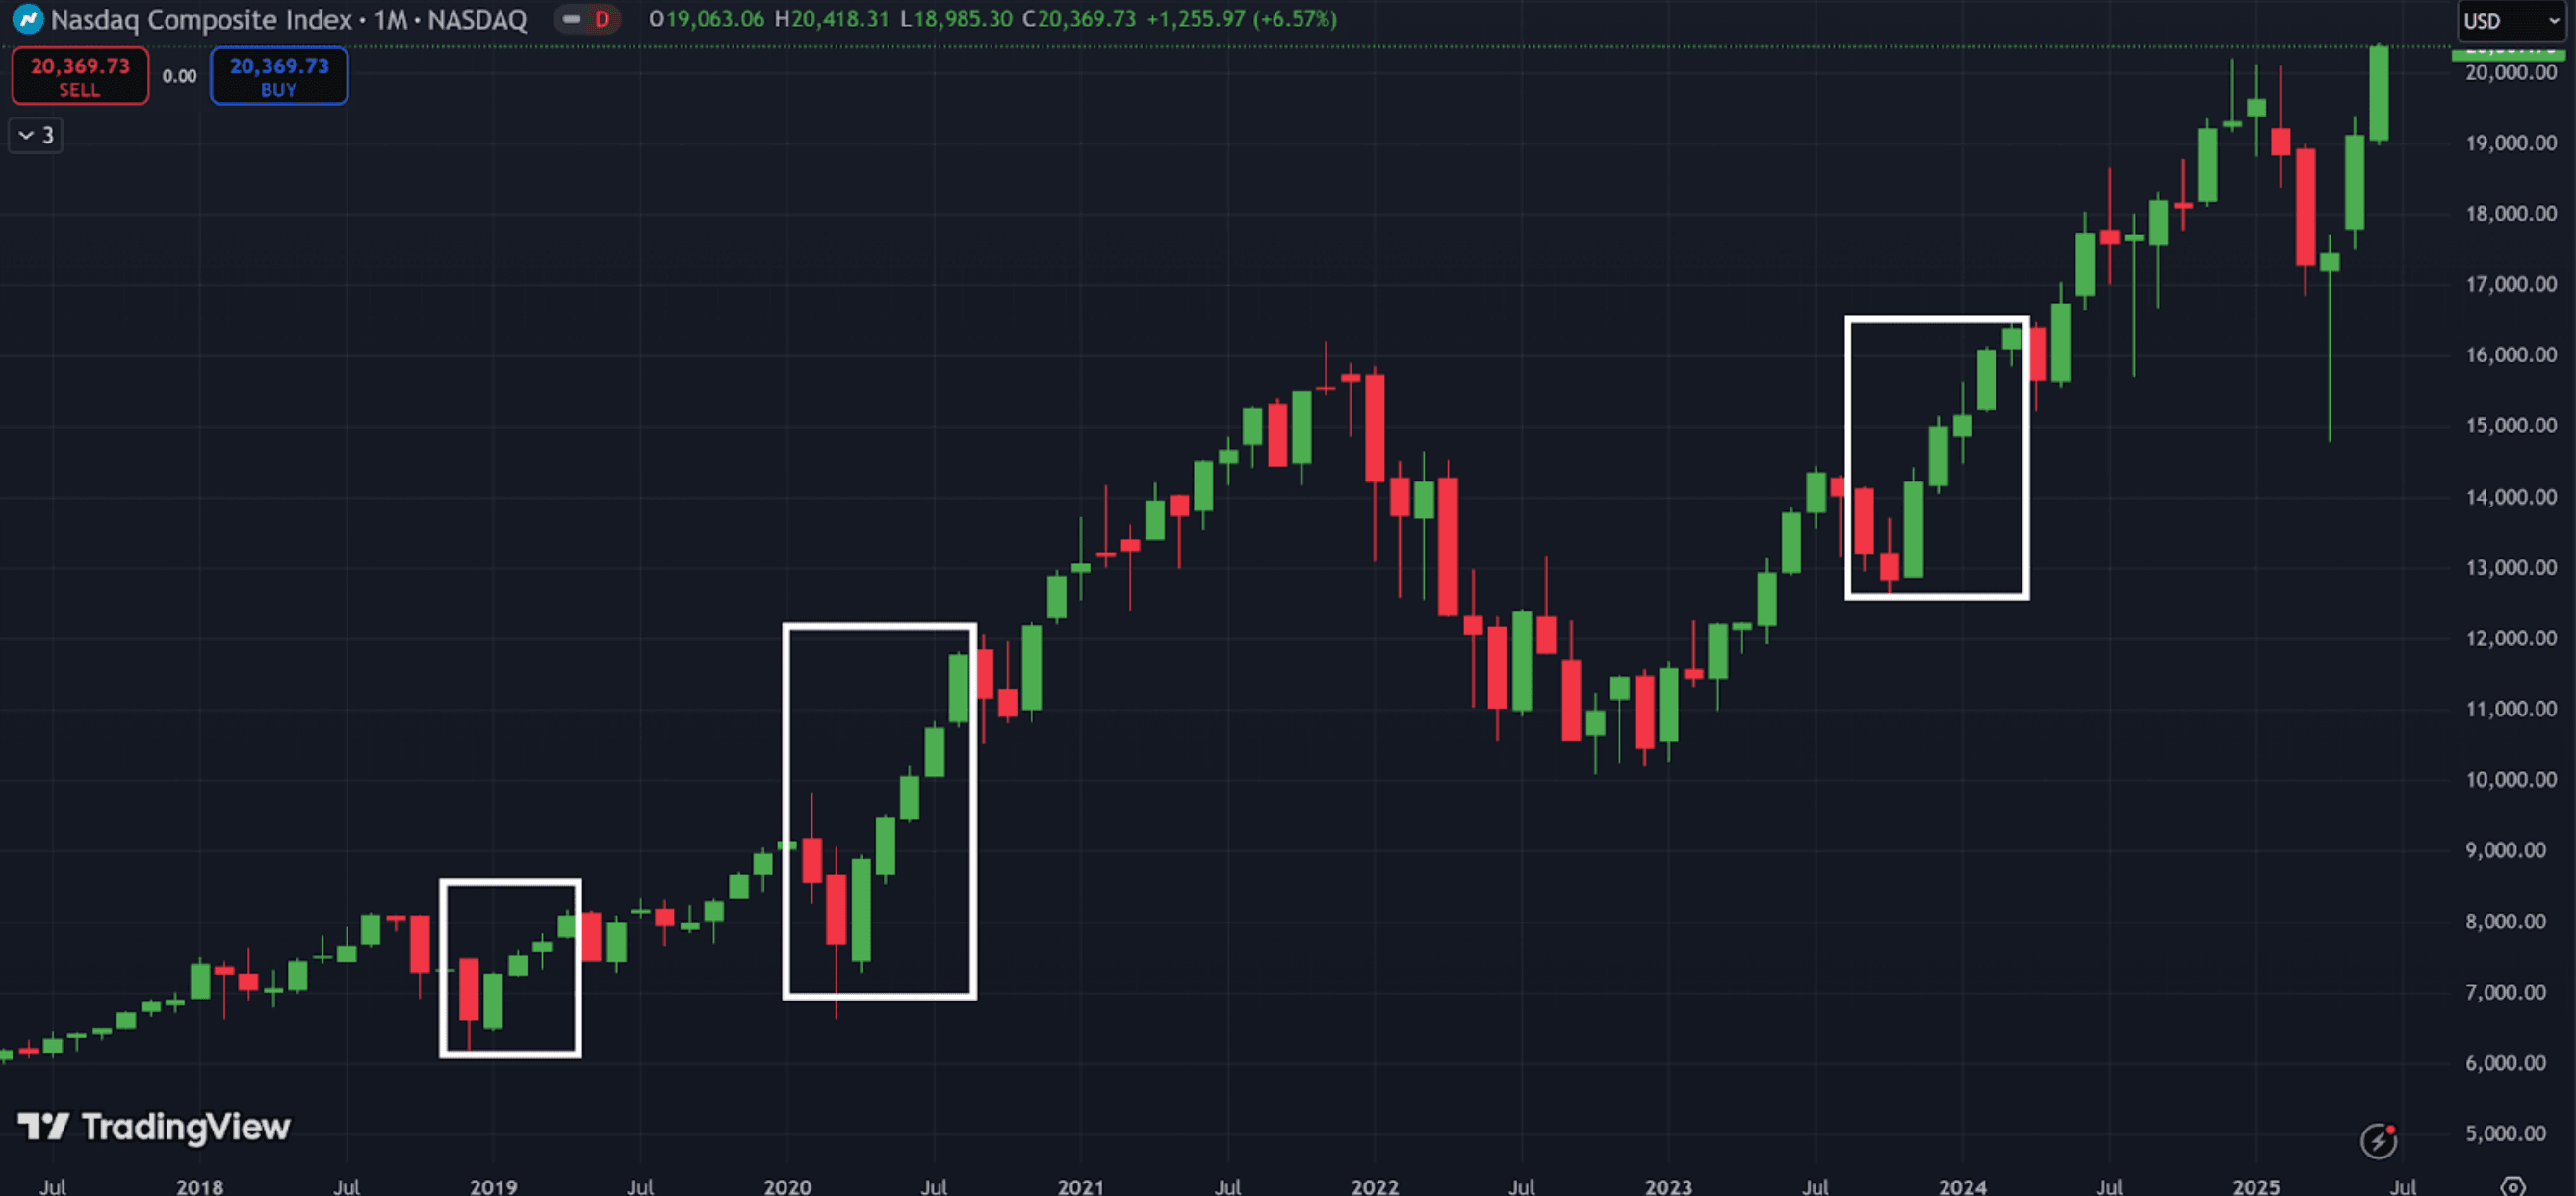
You can see that the past few times we saw two consecutive months of strong follow through following a large dip…
That follow through continued for at least a couple more months.
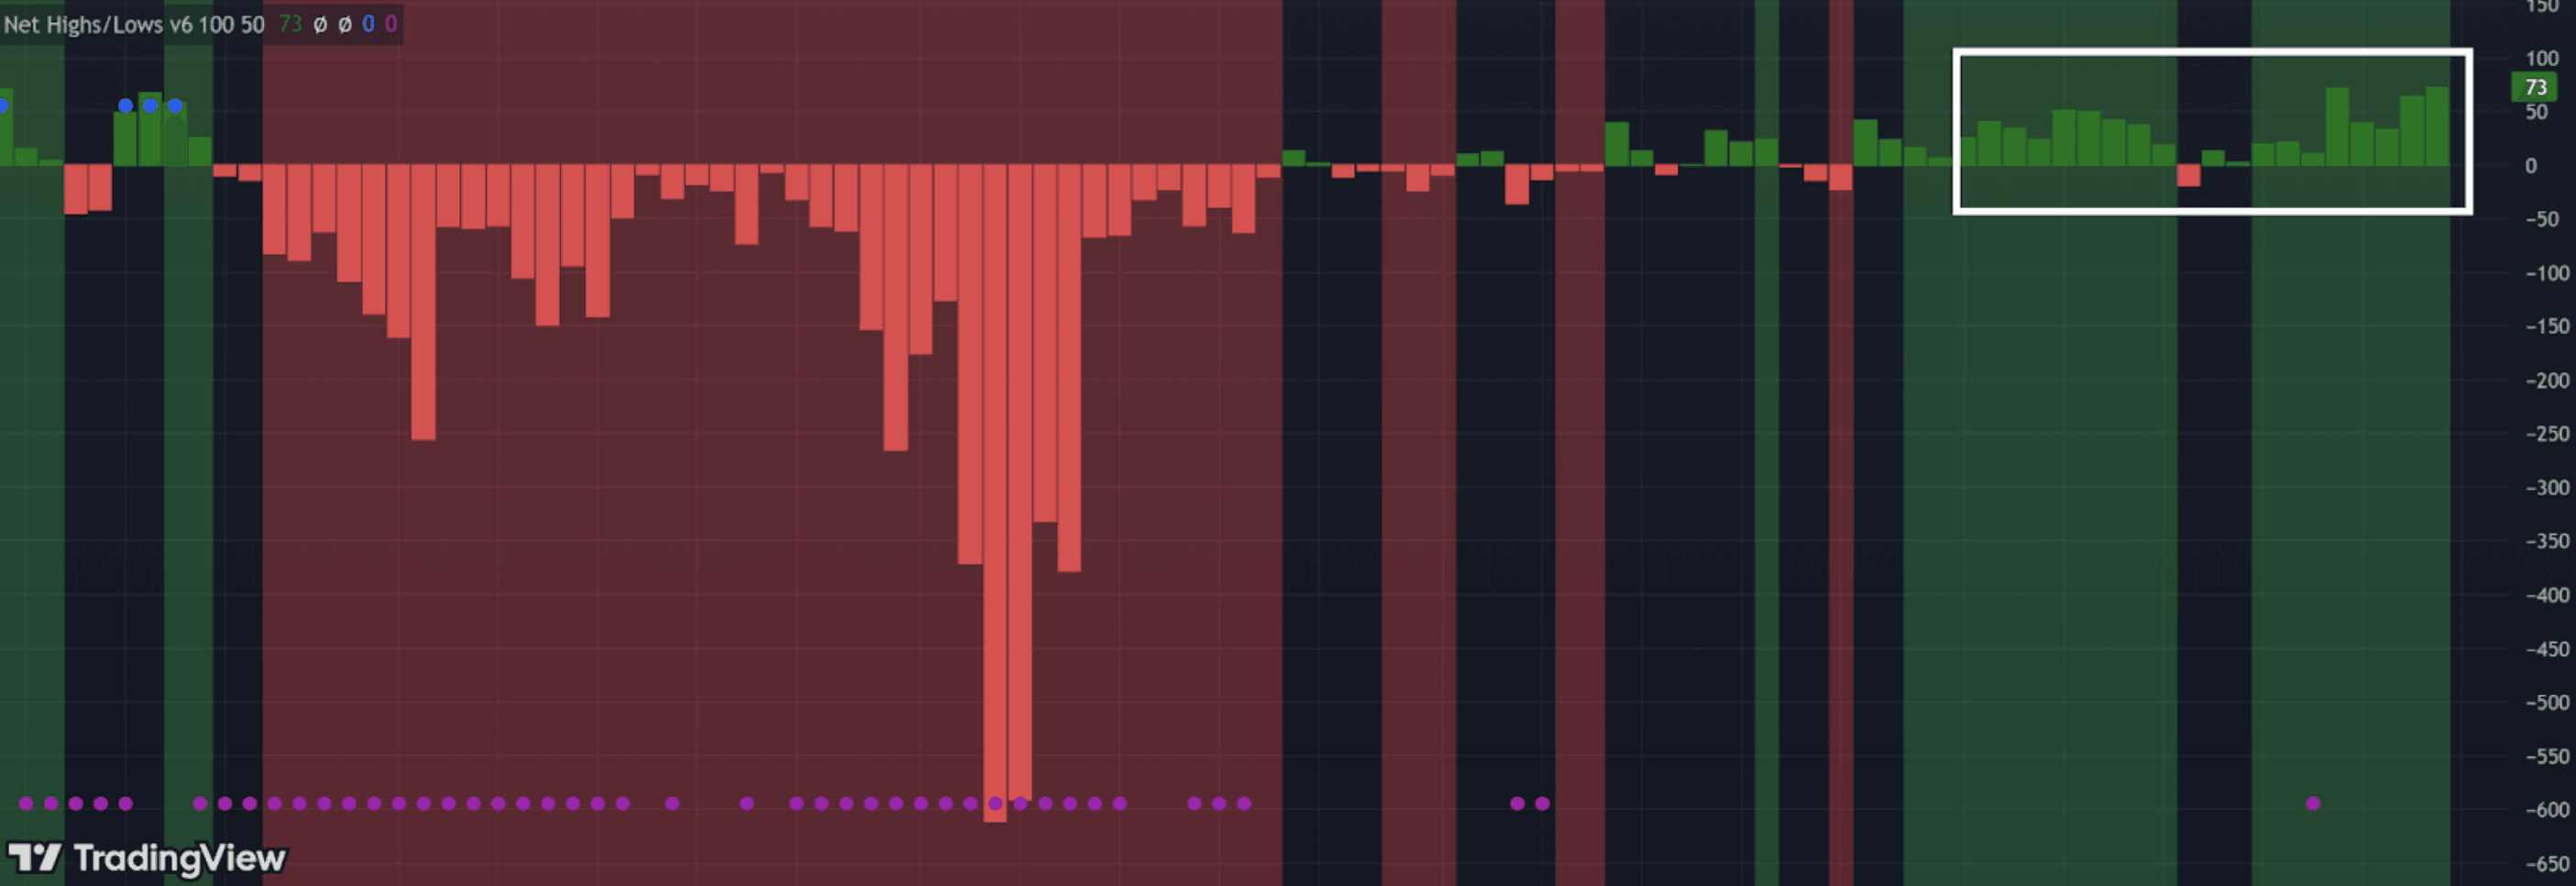
Net new highs also showed a healthy market – with it being green every single day of the month save one.
All in all, we’re seeing a nice healthy bull market…
One that I expect will continue for 6–18 more months.
There will be chop along the way – that’s expected, and healthy.
But we’re in a nice supportive market environment, so make sure you take full advantage of it.
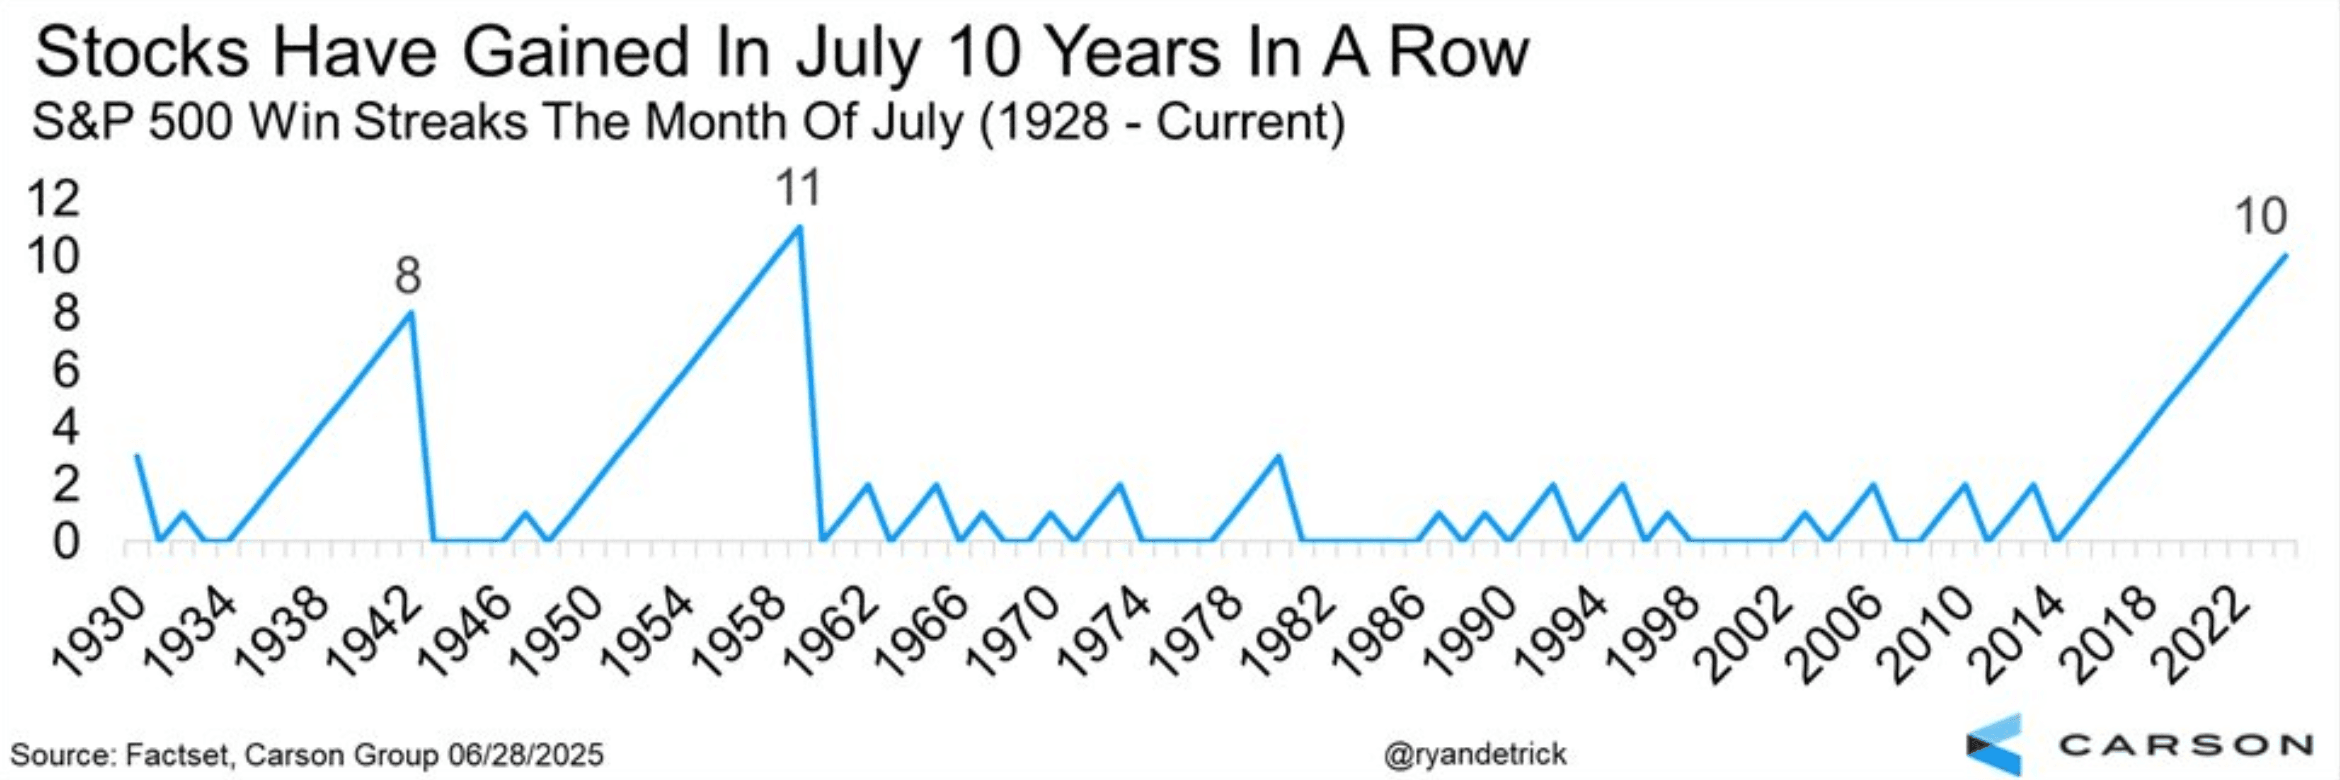
Especially because seasonality is also on our side.
So the question is – where are the biggest fastest-moving opportunities right now?
I share more on what I’m seeing below.
P.S Want to get this newsletter – and more – straight to your phone? Just text the word “trade” to 87858
Insight of the Day
The current bull market is still rather narrow – which gives us opportunities in the lagging stocks.
As I said before, this bull market is being led by the large mega-cap tech stocks.
Many others are still a couple steps behind…
Something you can see by looking at the Equal-Weighted S&P 500 Index, which is still over 3% away from fresh highs.
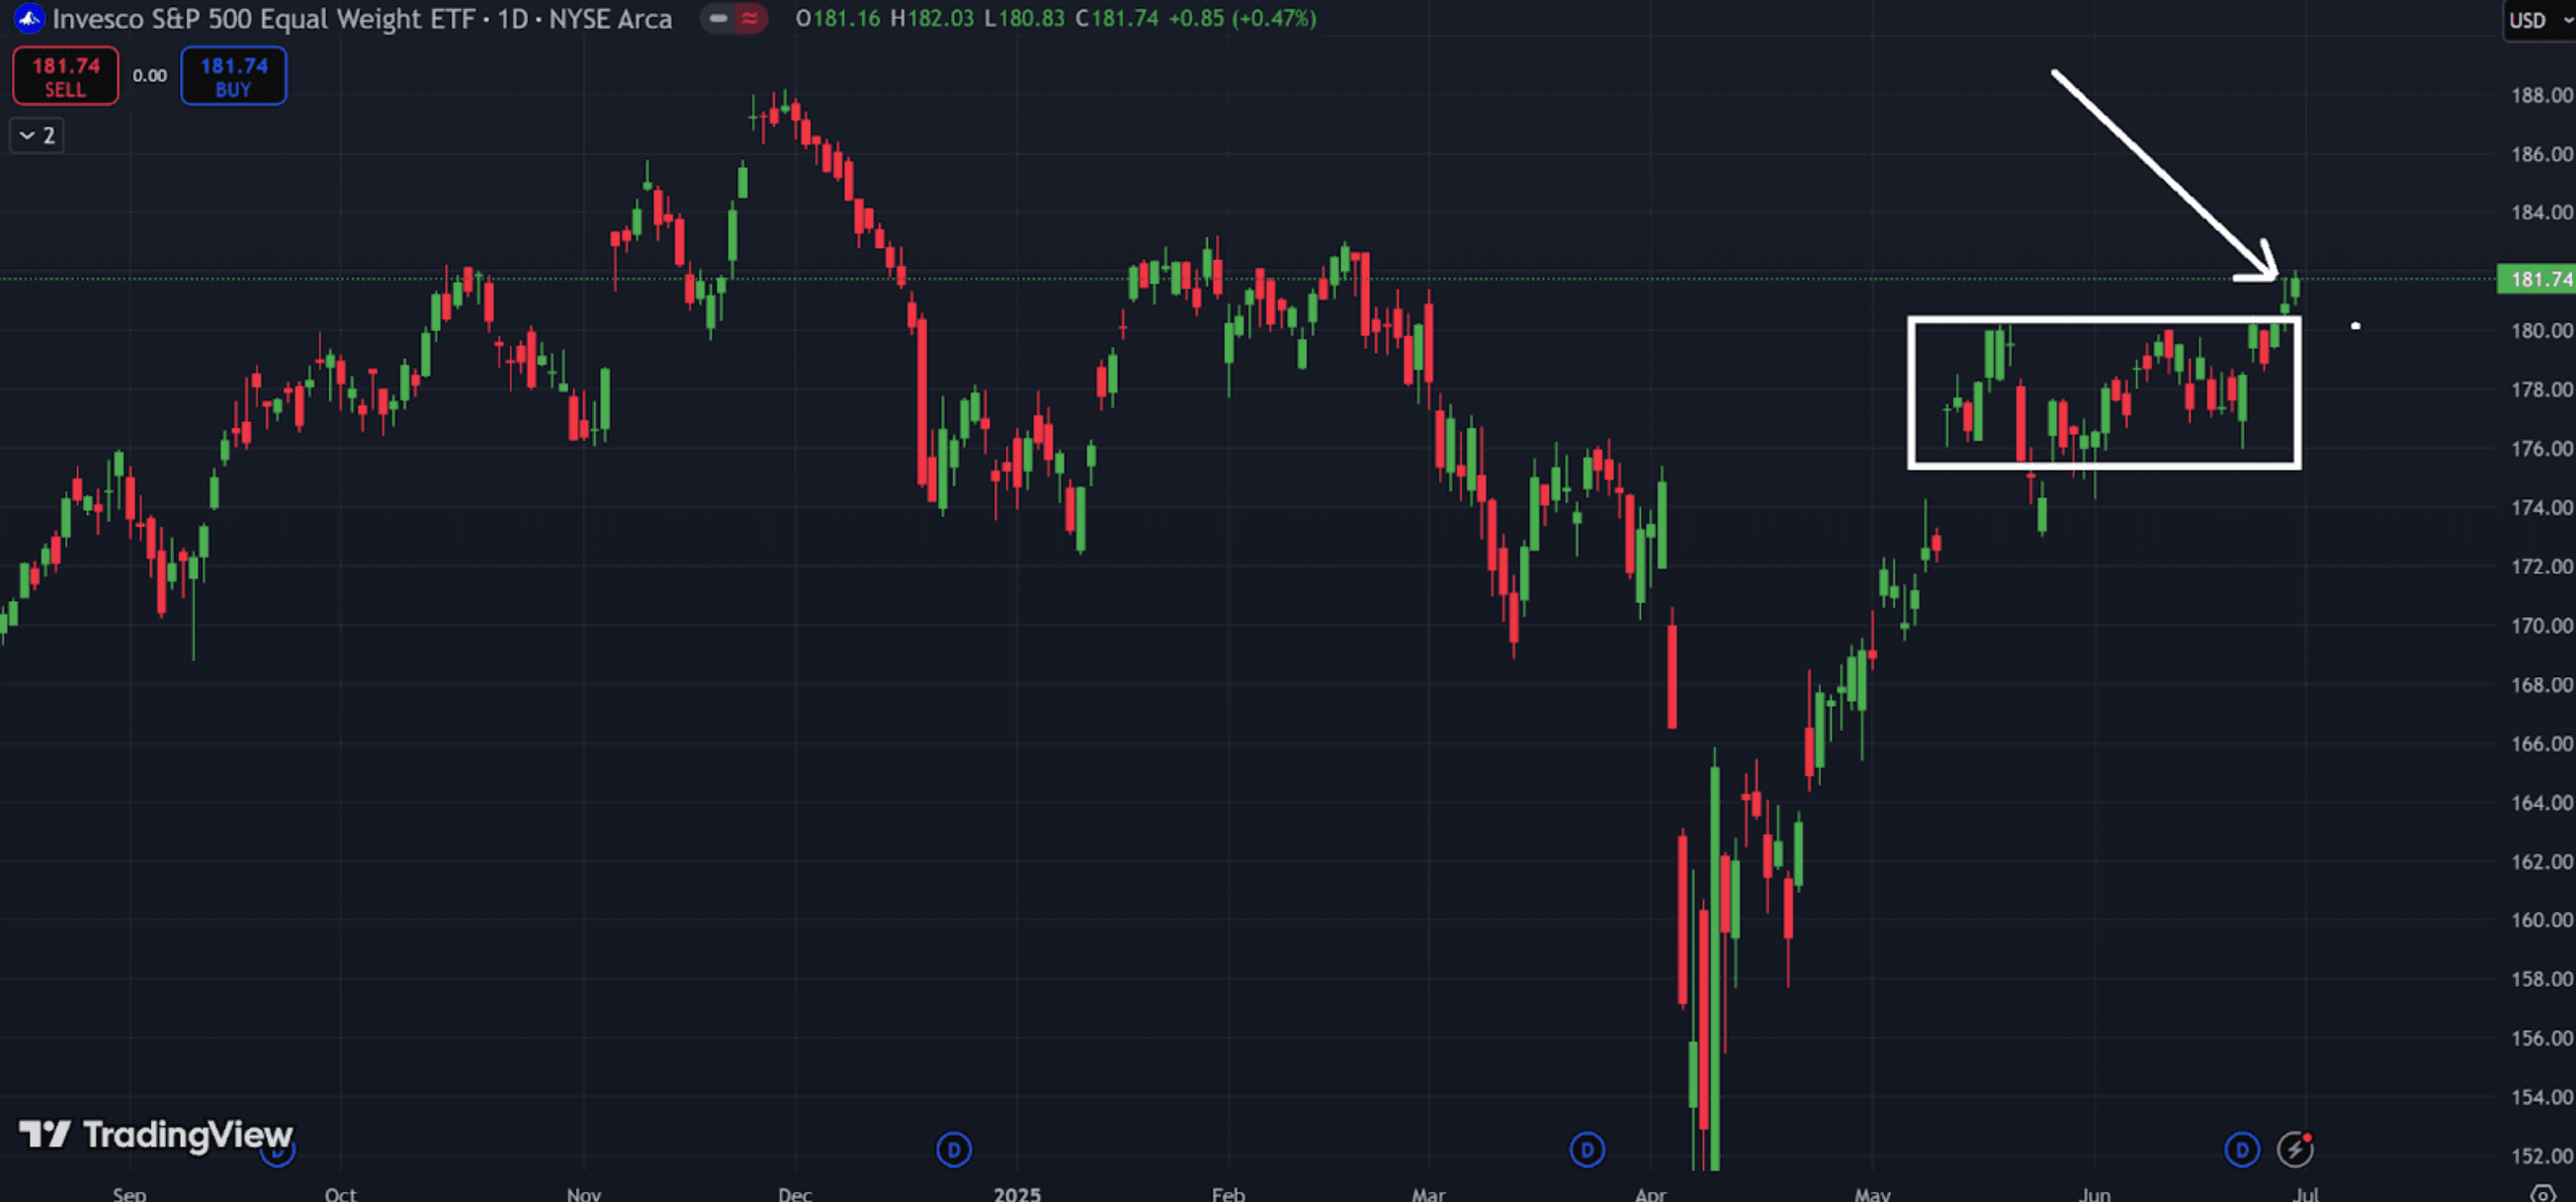
But you can also see that it’s starting to break out from a clear consolidation pattern – something I said would likely happen last week.
And now, it’s happening.
And since the most lucrative gains always happen at the beginning of a breakout – now is the time to position yourself.
In just a few hours later this morning at 11 a.m. Eastern…
I’m going LIVE to show you exactly how to apply this same “breakout pattern” to individual stocks…
So you can target the truly explosive moves in this market.
I’m talking about moves like 148% in two days… 353% in three months… and even 413% in 8 months.
Remember, while we look at the broader market indexes for guidance…
The real opportunity is in these individual stocks.
So click here to lock in your spot for my live strategy session if you haven’t yet…
And I’ll see you in just a bit at 11 a.m. ET.
I’ll also show you some of the top breakout setups I see forming right now – so don’t miss it.
Customer Story of the Day
“Ross and his staff at Traders Agency are great.
Not only sharing profitable stock trades in real time, but also explaining everything in a common language and making me feel like part of a smart, thriving community.
I highly recommend.”

Ross Givens
Editor, Stock Surge Daily
See more from Traders Agency on Google
Make us a preferred source and our market analysis will appear more prominently in your Google Search, Top Stories, and AI results.
Add to Preferred Sources