Today, we’re going to talk about the “Symmetrical Triangle” pattern.
Just like a regular channel, the symmetrical triangle is a consolidation pattern.
The biggest difference between the two is that while a channel typically has two near-parallel boundaries, the symmetrical triangle pattern is defined by a descending resistance level and an ascending support level.
When you put both levels together on the stock chart, they create a pattern that looks like a triangle with two converging lines.
Let me show you what I mean…
Charting the Symmetrical Triangle
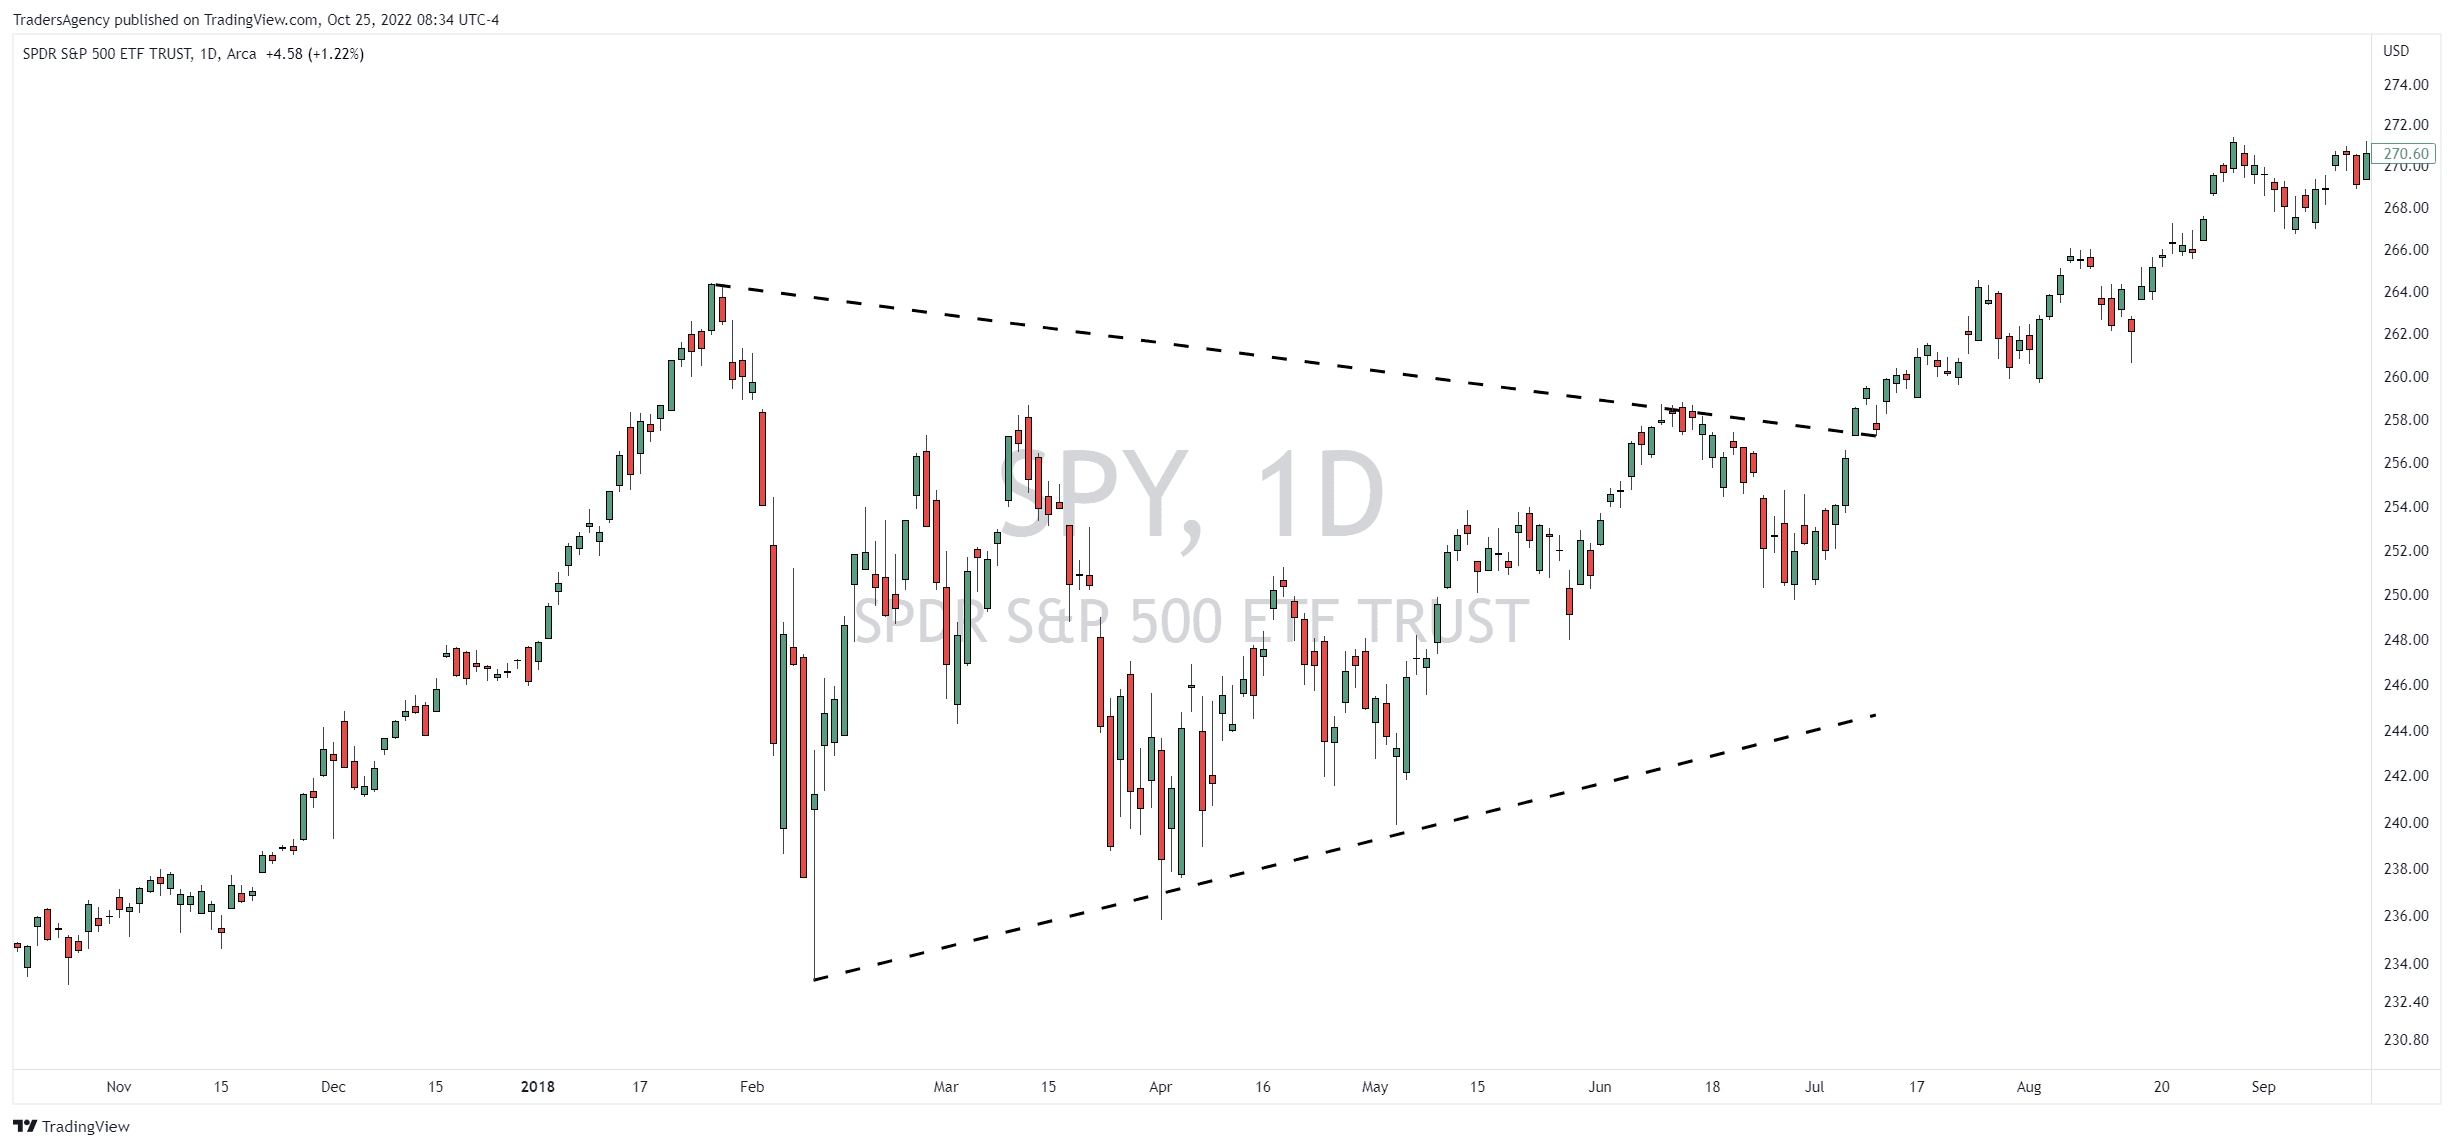
On a stock chart, a symmetrical triangle pattern should show clear levels of support and resistance.
For example, take a look at the daily chart of the SPDR S&P 500 ETF Trust (SPY) from 2018 below.
The market was going nearly parabolic as 2018 began, but it plunged a quick 12% in early February.
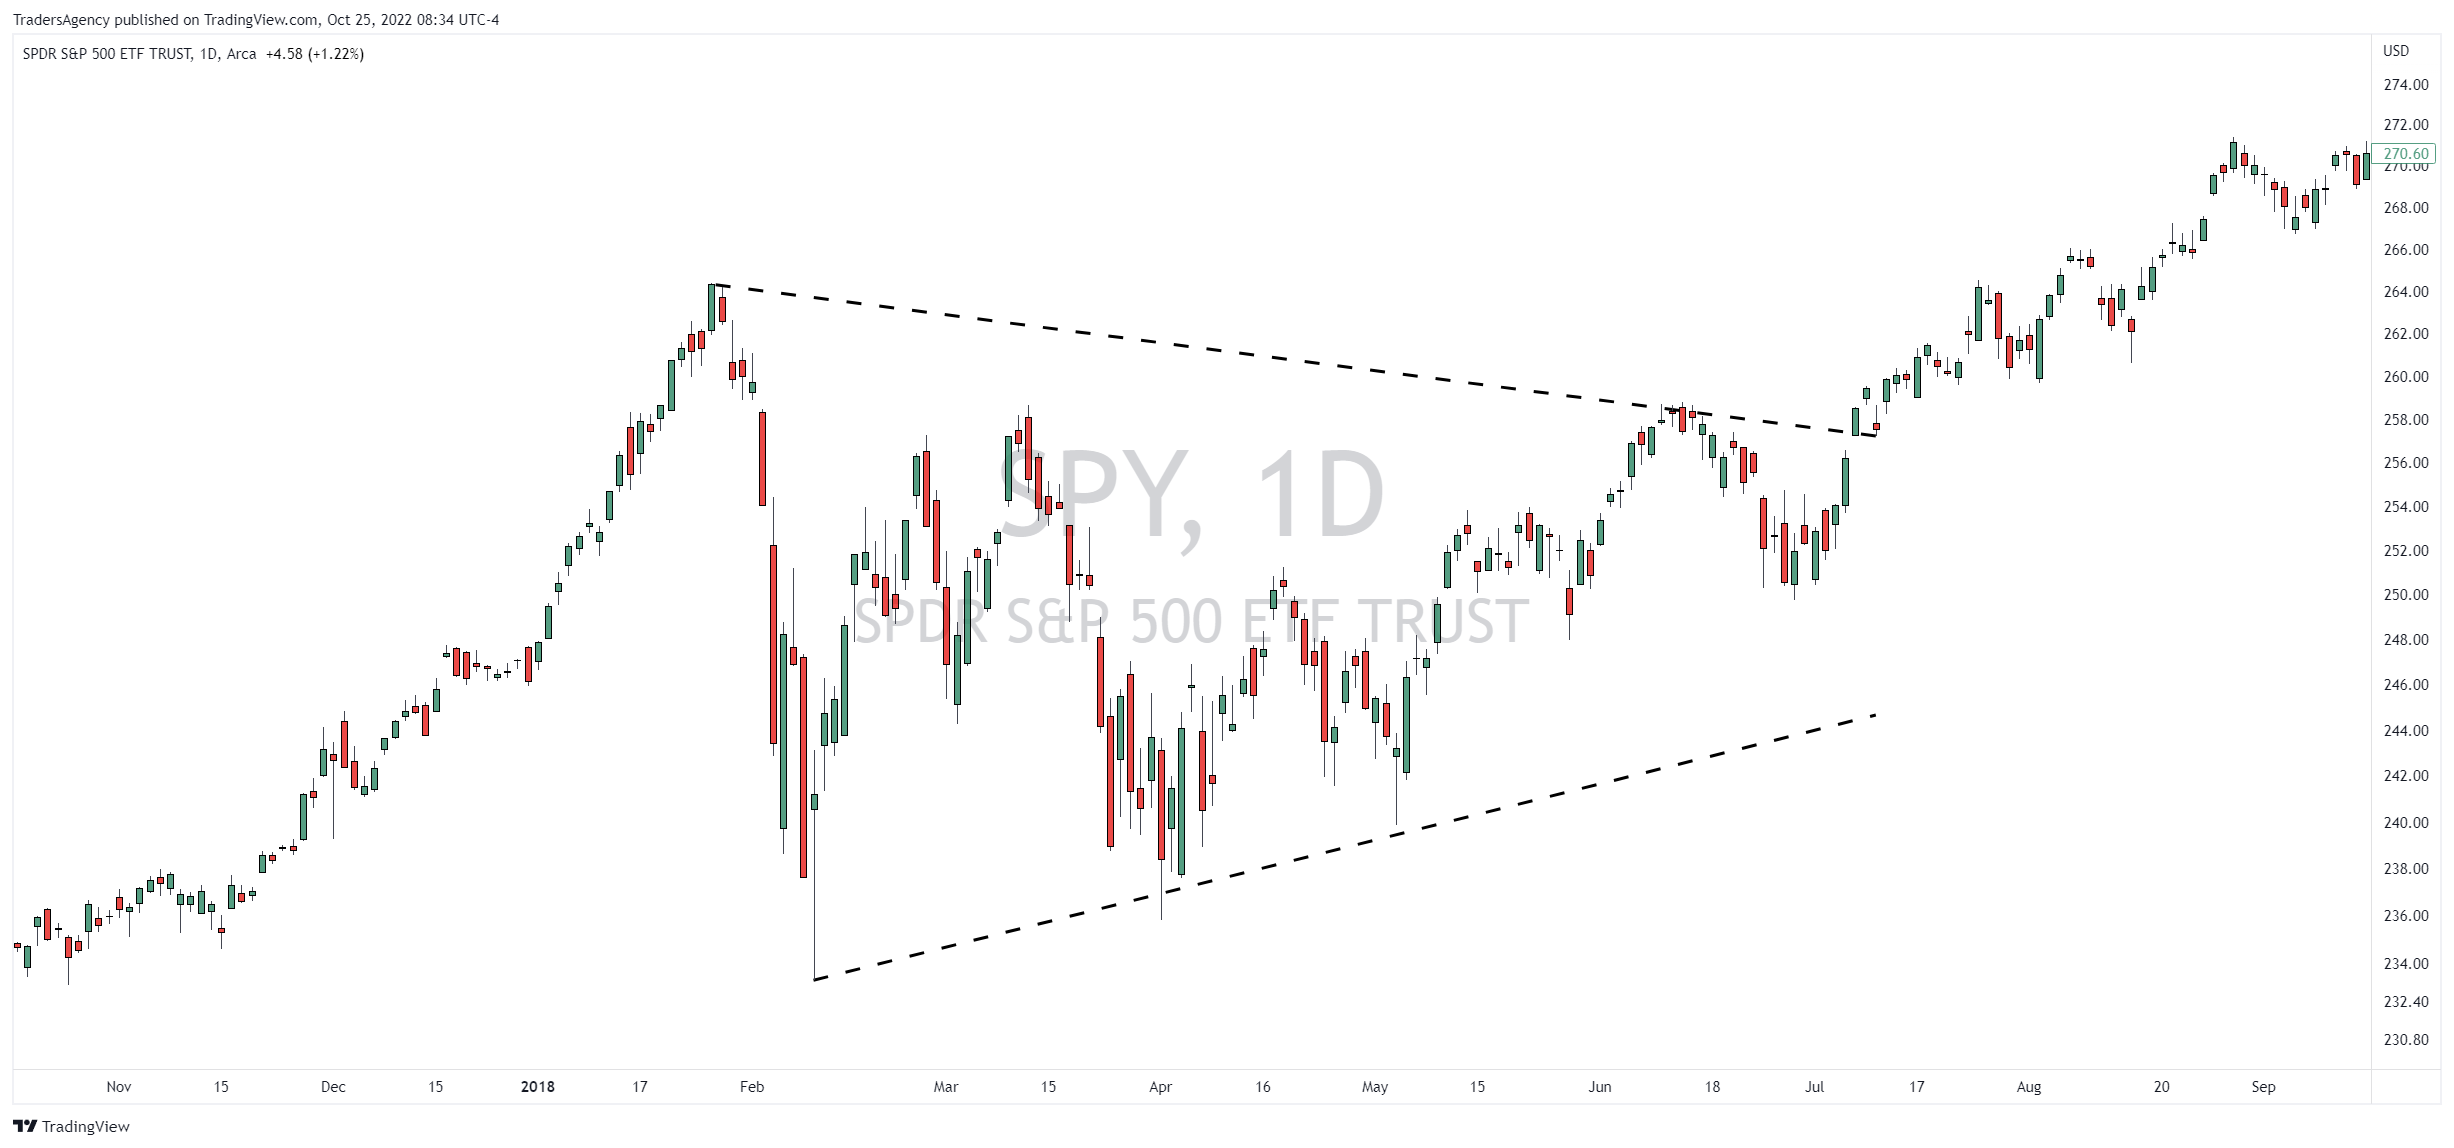
As you can see in the daily chart above, that created the high and low points where our symmetrical triangle began.
Identify the Boundaries
You will notice that I’ve drawn a resistance line from the top of the initial peak and a support line from the bottom of the initial drop.
In this example, I was able to connect two high points to form the resistance line and three low points to form the support line.
Keep in mind that there are endless ways to draw these boundaries and connect different price points.
But what you really want to see are these two boundaries converging into a single point at the tip of the triangle.
Projecting the Pattern
Typically, the market will either break our or break down before price makes it to the point of the triangle.
And we can project the target based on the height of the triangle pattern. In this case, however, the target was not reached right away…
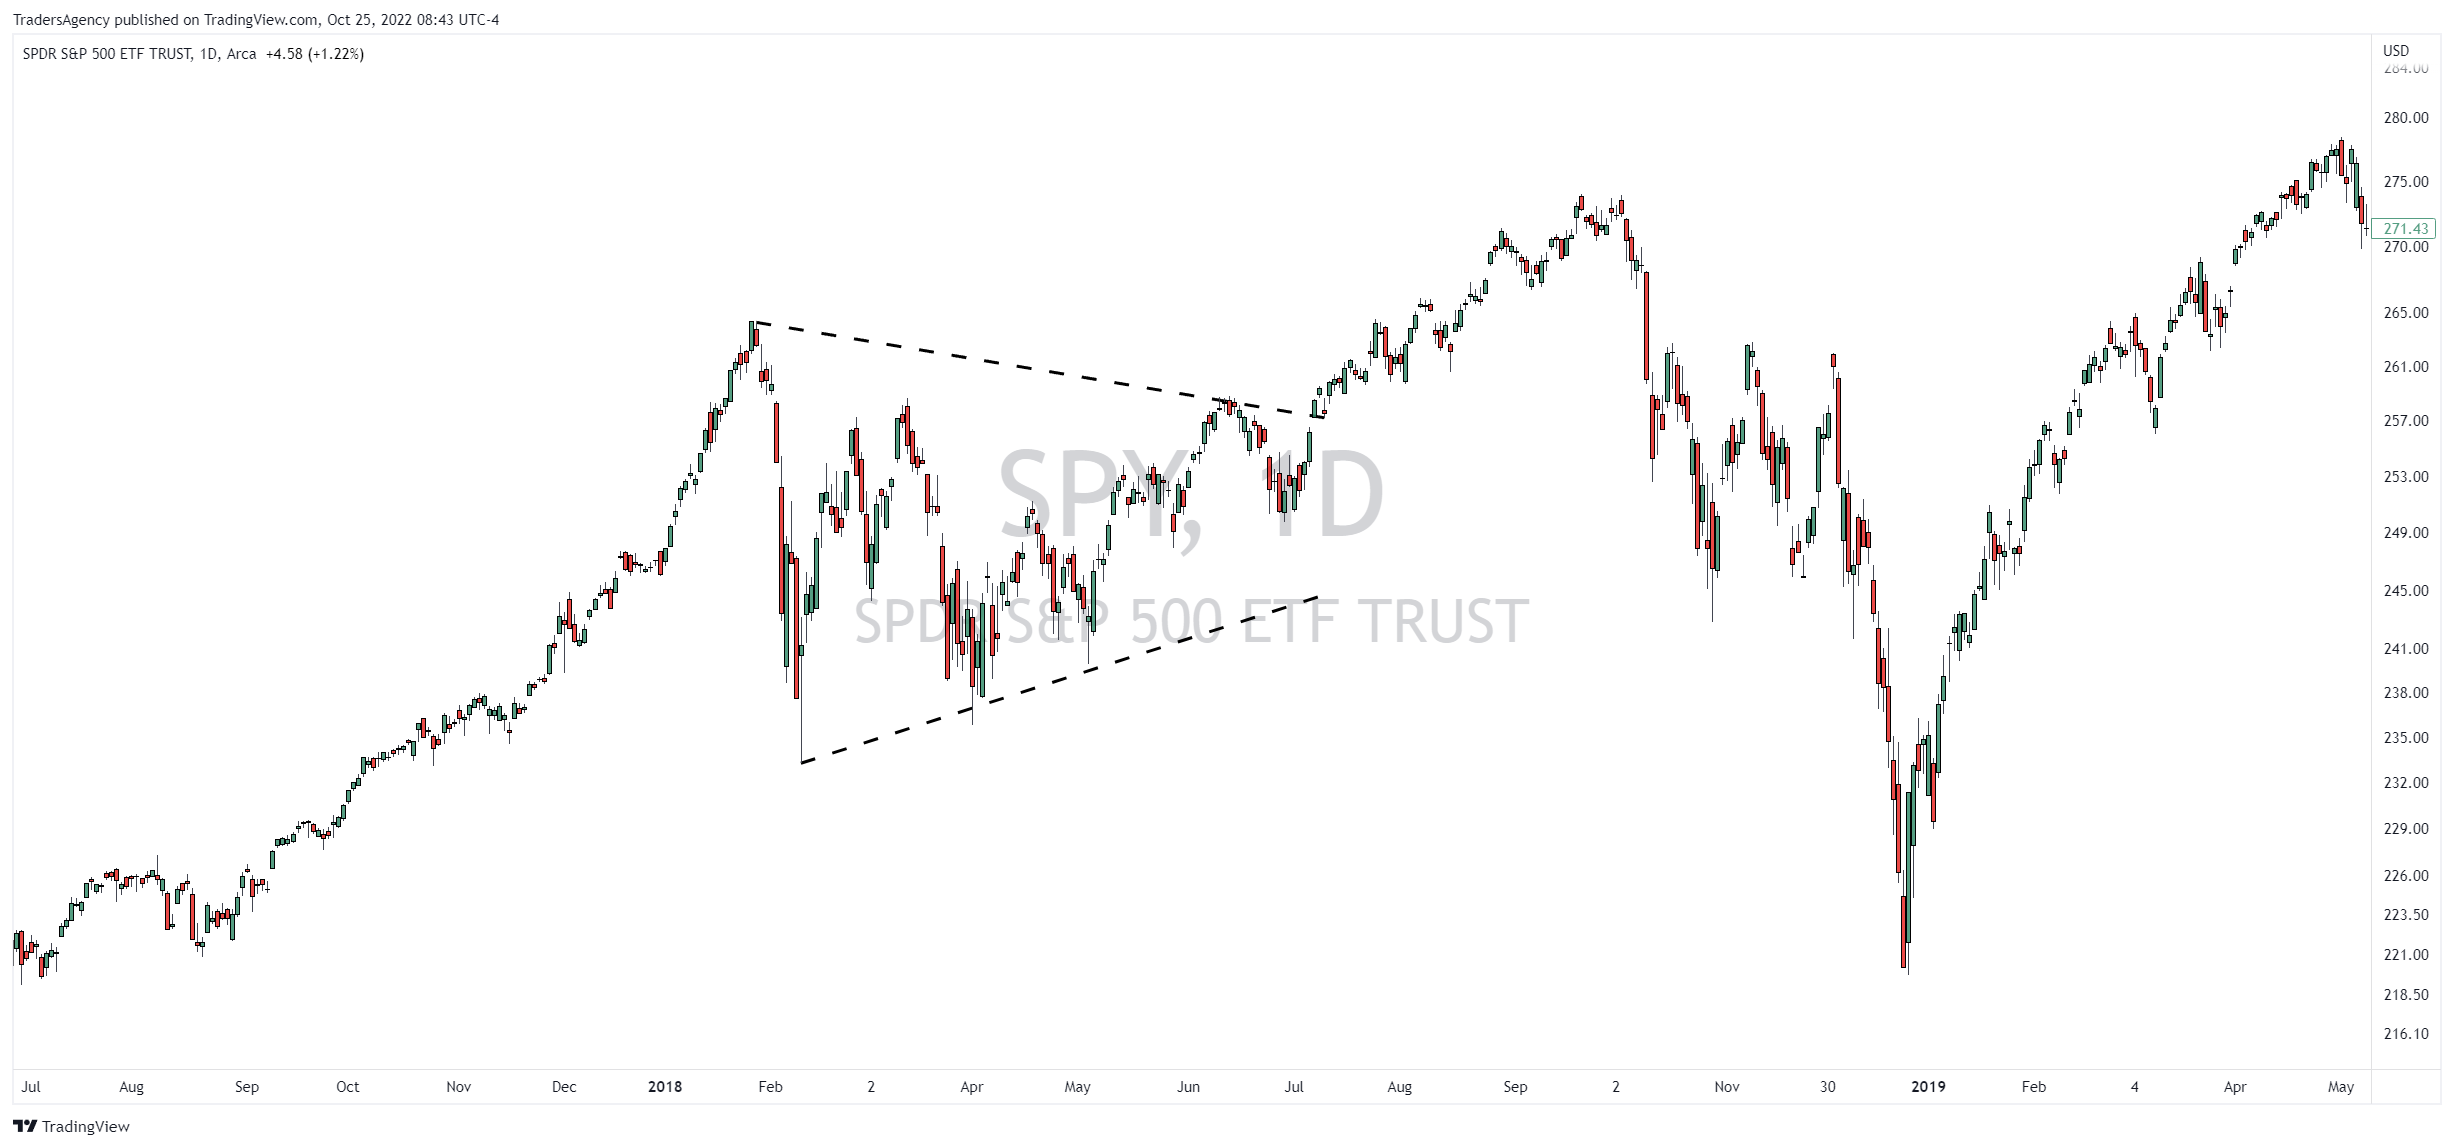
This symmetrical triangle had a height of roughly $30 at the widest point.
But that target was actually not fulfilled until many months later due to the market plunge at the end of 2018.
This is a good reminder that technical analysis and chart patterns aren’t always picture-perfect.
When you’re trading these patterns, it’s okay to keep the textbook definition in mind.
In fact, you should!
But you should also make sure to maintain your trading discipline and expect the unexpected because Mr. Market doesn’t always cooperate.
Trade with the Insiders
It’s clear that patterns like these have huge potential embedded in them, and they reflect traders’ expectations about the market.
But if you want a more fundamentally driven strategy for getting ahead of big market moves before they happen, consider this…
When corporate insiders like CEOs, CFOs, executives and board members put down their own hard-earned money to buy shares of their own companies, it’s a huge vote of confidence.
After all, these folks have a footing of knowledge about their companies that Main Street investors simply do not.
It’s absolutely free to attend, so I really hope you’ll check it out.
I’ll cover my strategy for trading alongside corporate insiders and generating potentially massive gains with less risk.
Just click here to register for this special Insider Effect LIVE session now!
Embrace the surge,

Ross Givens
Editor, Stock Surge Daily
See more from Traders Agency on Google
Make us a preferred source and our market analysis will appear more prominently in your Google Search, Top Stories, and AI results.
Add to Preferred Sources