
The price to earnings ratio is one of the first numbers investors look at when deciding whether a stock is cheap or expensive relative to what the company actually earns. You calculate it by dividing a company's share price by its earnings per share, and it tells you how much you're paying for each dollar of profit. By the end of this guide, you'll know how to calculate it, where to find the data, and how to sidestep the most common mistakes beginners make when using it.
You've probably seen this happen: someone mentions a stock has a "P/E of 45" and everyone nods like that means something, but nobody explains what it actually tells you. Is 45 good? Bad? Does it depend on the company? The honest answer is that it depends on several things, and that's exactly what we're going to teach you here.
We'll walk you through the price to earnings ratio formula, show you a full calculation with real numbers, explain what counts as "good" across different industries, and cover the situations where this metric completely falls apart. It's one of the most useful tools in fundamental analysis, but only if you understand its limits.
What Is the P/E Ratio?
Bottom Line: The price to earnings ratio is a starting point for judging valuation, not a final answer: a high or low number only means something when compared against industry peers, growth expectations, and earnings quality. Treat P/E as one input alongside revenue trends, debt, and market conditions rather than a standalone signal, since cheap ratios can reflect real business problems instead of a bargain.
The price to earnings ratio (P/E ratio) is a valuation metric that compares a company's current share price to its earnings per share (EPS). It answers a simple question: how many dollars are investors willing to pay today for one dollar of the company's annual profit?
Think of it like buying a small business. If a local coffee shop earns $50,000 a year in profit and the owner wants $500,000 for it, you're paying 10 times earnings. That's the same logic behind a stock's P/E ratio, just applied to a publicly traded company where you can buy a tiny slice of ownership instead of the whole thing.
A high P/E generally means investors expect strong future growth and are willing to pay a premium for it now. A low P/E can mean the stock is undervalued, or it can mean the market has real concerns about the company's future. The ratio by itself won't tell you which one is true, and that's why we never recommend using P/E in isolation.
Key Concept: The P/E ratio measures how much investors are paying for each dollar of a company's annual profit. It's a price tag on earnings, not a verdict on quality.
How Do You Calculate the P/E Ratio?
You calculate the P/E ratio by dividing the current share price by the earnings per share. Both numbers are publicly available: share price updates in real time, while EPS comes from a company's quarterly or annual financial statements.
P/E Ratio Formula
The formula is straightforward:
P/E Ratio = Share Price ÷ Earnings Per Share (EPS)
And EPS itself is calculated as:
EPS = Net Income ÷ Outstanding Shares
So if a company earned $2 billion in net income last year and has 1 billion shares outstanding, its EPS is $2.00. If the stock trades at $40 per share, the P/E ratio is $40 ÷ $2.00 = 20. Investors are currently paying 20 times the company's annual per-share earnings for that stock.
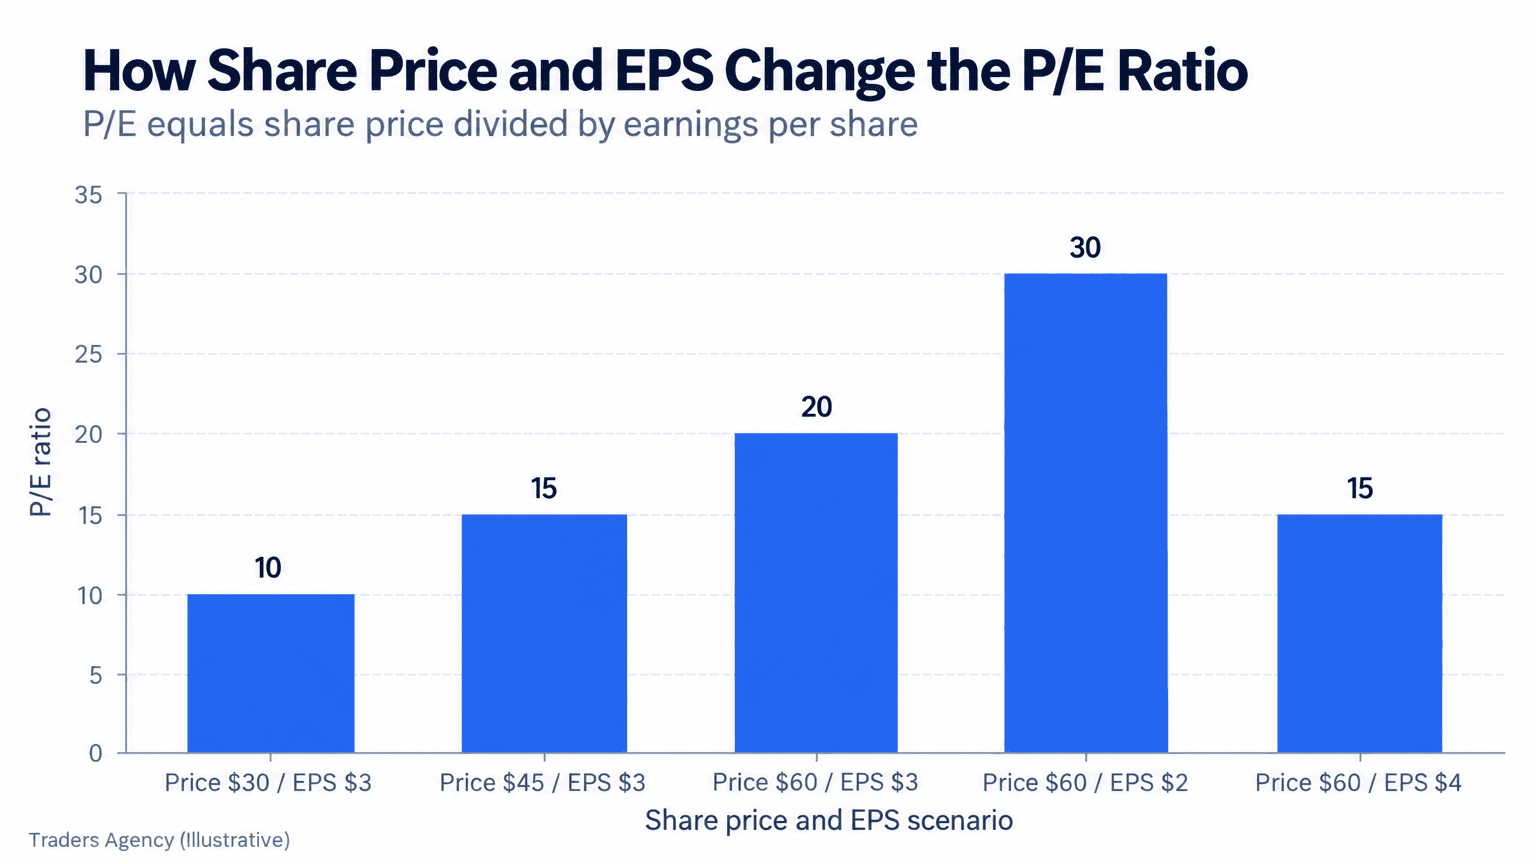
Notice how the ratio can move in two directions. If the share price rises while EPS stays flat, the P/E goes up, meaning the stock is getting more expensive relative to its earnings. If EPS grows faster than the price, the P/E actually falls, even though the stock hasn't dropped in value. That's why a rising P/E isn't automatically bad news and a falling P/E isn't automatically good news.
Where to Find the Data
You don't need to calculate this by hand every time. Here's where we point our members for reliable numbers:
- Brokerage screeners: Most trading platforms display trailing P/E directly on a stock's quote page
- Company financial statements: Quarterly and annual reports filed with the SEC (10-Q and 10-K filings) list net income and shares outstanding directly
- Investor relations pages: Public companies post earnings releases with EPS figures the same day they report
- Financial data sites: Sites that aggregate SEC filings will show historical P/E trends over multiple years
If you want to verify a number you see quoted somewhere, the SEC's EDGAR database holds the original source documents for net income and share counts, since that's what every other site pulls from.
What Is a Good PE Ratio?
There's no single number that qualifies as a good PE ratio across the entire market. A "good" P/E depends heavily on the industry, the company's growth rate, and where we are in the broader economic cycle.
That said, we can give you some useful reference points. Historically, the price to earnings ratio S&P 500 average has hovered somewhere in the 15 to 25 range over long stretches of time, though it has spent extended periods well above and below that band. A stock trading noticeably below the broader market average isn't automatically a bargain, and one trading well above it isn't automatically overpriced. Context always matters more than the raw number.
Why "Good" Depends on the Sector
Different industries carry structurally different P/E ranges because they grow, and earn, in fundamentally different ways.
- Financial and utility companies often trade at lower P/E ratios (commonly in the 10 to 15 range) because they're mature, stable, and grow slowly
- Technology and consumer growth companies often trade at higher P/E ratios (sometimes 25 to 35 or more) because investors are pricing in faster future earnings growth
- Cyclical industries like autos or industrial manufacturing can swing between very low and very high P/E depending on where they sit in the economic cycle
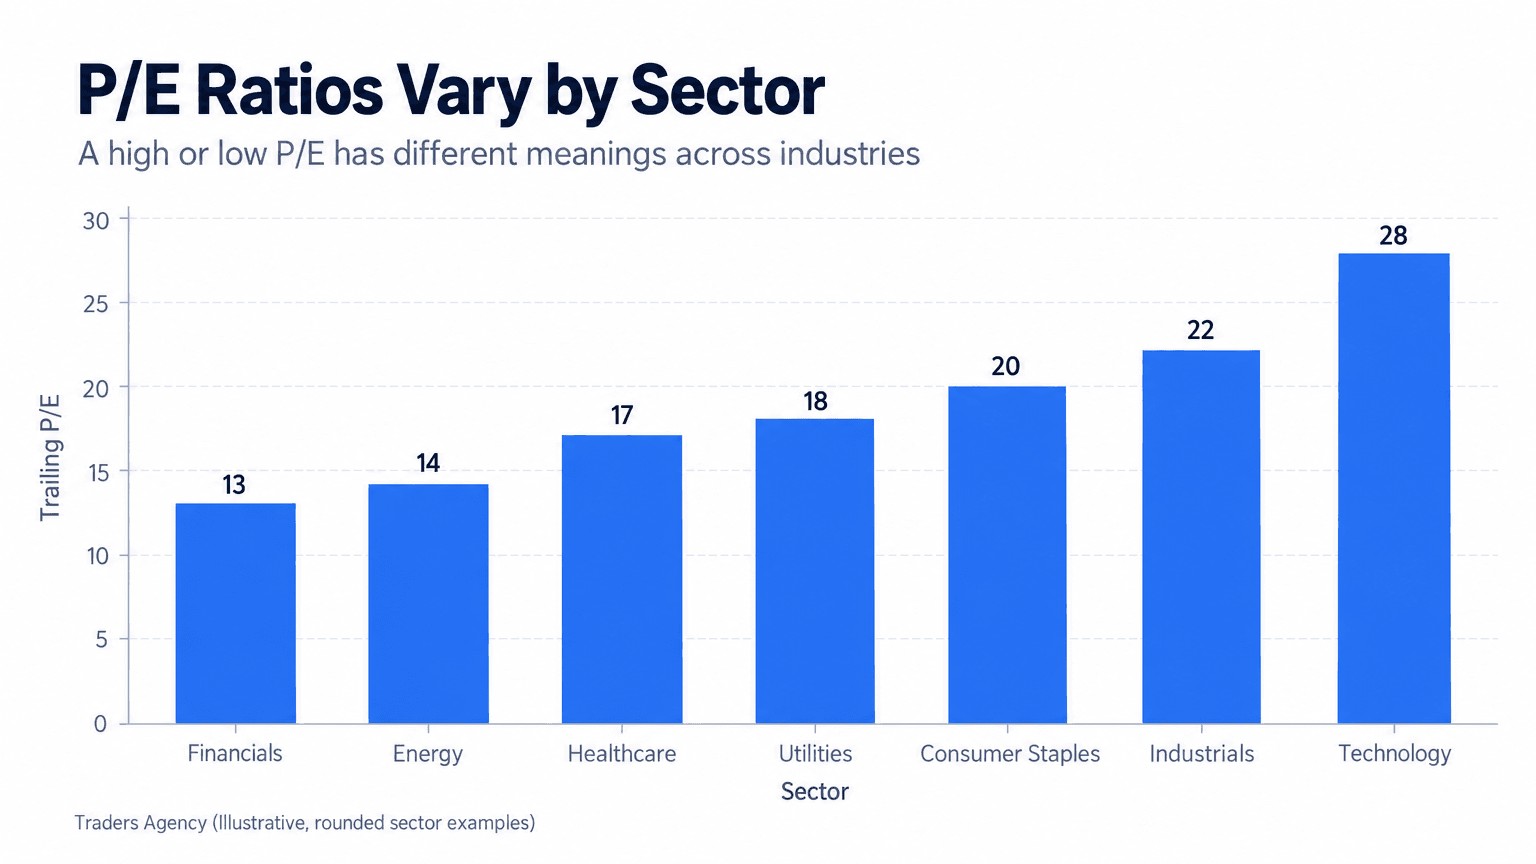
This is exactly why we teach our members to compare a company's P/E against its own industry peers rather than against the market as a whole. Comparing a bank's P/E directly to a software company's P/E tells you almost nothing useful.
Is 40 a Good PE Ratio?
A P/E of 40 can be perfectly reasonable for a fast-growing technology company but would be a serious red flag for a mature utility. The number itself is neutral. What matters is whether the underlying growth rate justifies the price investors are paying.
For a company growing earnings at 35% to 40% per year, a P/E of 40 works out to a PEG ratio near 1.0, which is generally viewed as fairly priced relative to that growth. For a company growing earnings at 5% per year, a P/E of 40 looks stretched and could signal the stock is priced for perfection with little room for disappointment.
The Warren Buffett Principle Behind the Ratio
The core idea associated with Warren Buffett's investing philosophy is that price is what you pay while value is what you get. A low P/E alone doesn't make a stock a good investment if the underlying business is weak. That broader approach emphasizes buying quality businesses at a reasonable price rather than simply chasing the cheapest ratio on a screen.
That philosophy lines up with how we teach the ratio: P/E is a starting point for further research, not a final verdict on whether a stock is worth owning.
Want expert trading insights delivered daily?
Join thousands of traders who rely on Traders Agency for market analysis and trade ideas.
Join Traders AgencyWhat's the Difference Between Trailing and Forward P/E?
There are two main versions of the P/E ratio, and mixing them up is one of the most common beginner mistakes we see.
| Version | Earnings Used | What It Reflects |
|---|---|---|
| Trailing P/E | Past 12 months of reported earnings | Actual, confirmed results |
| Forward P/E | Next 12 months of estimated earnings | Analyst projections, not facts |
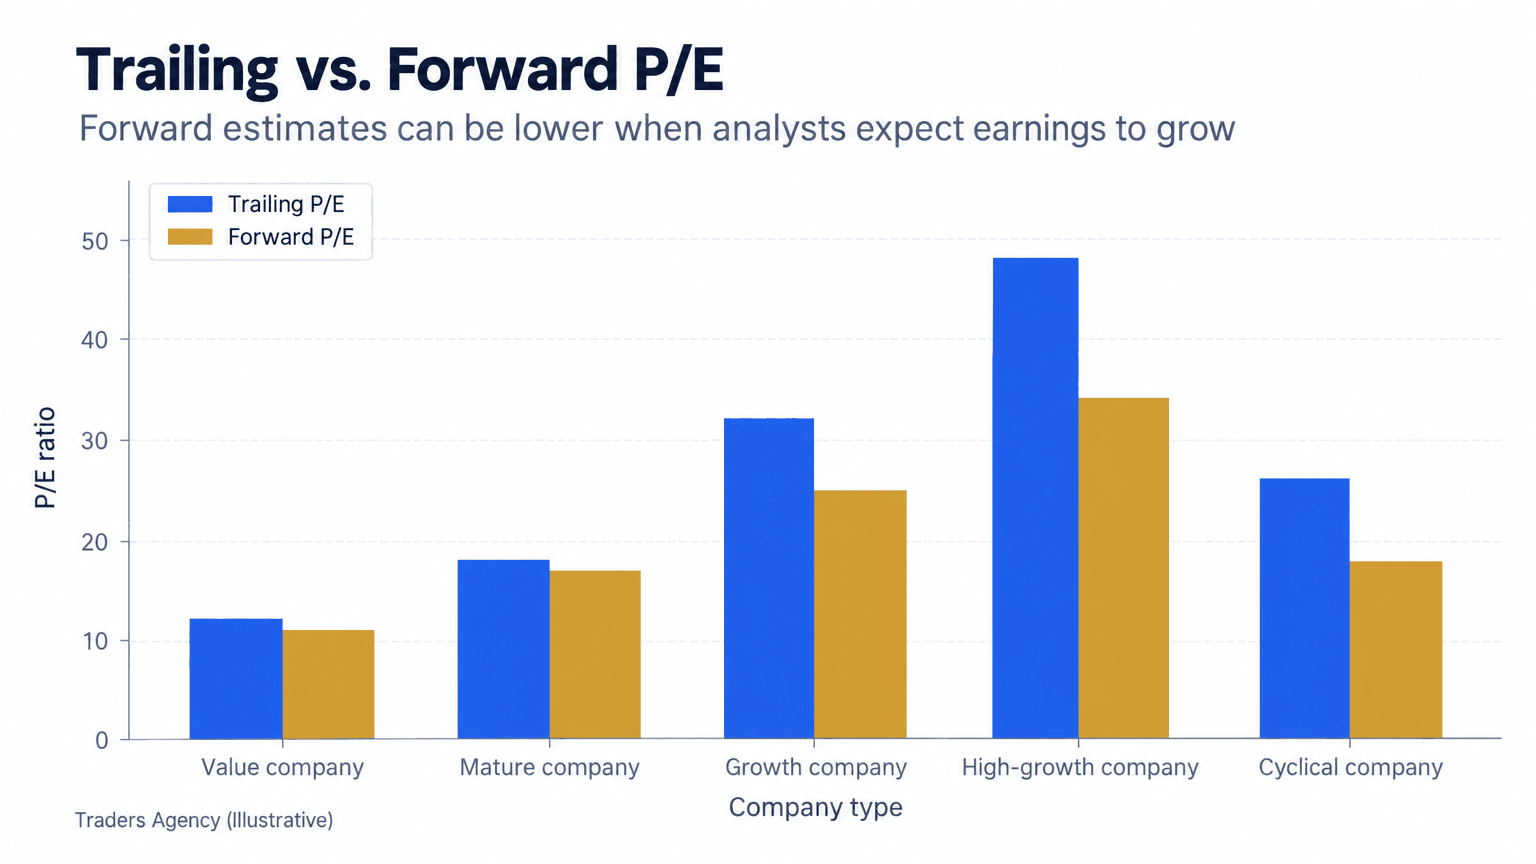
Here's why the gap between the two matters. If a company's forward P/E is much lower than its trailing P/E, analysts expect earnings to grow quickly, which pulls the ratio down even at the same share price. If forward P/E sits higher than trailing P/E, analysts expect earnings to shrink. We always check both numbers before drawing a conclusion, because relying on just one can give you a skewed picture of what the market actually expects.
Price-to-Earnings Ratio Example
Let's work through a full price-to-earnings ratio example using realistic, round numbers.
Imagine a company called BrightPath Retail trades at $60 per share. Over the past 12 months, it earned $300 million in net income and has 100 million shares outstanding.
| Input | Value |
|---|---|
| Share Price | $60.00 |
| Net Income (trailing 12 months) | $300 million |
| Shares Outstanding | 100 million |
| Earnings Per Share | $3.00 |
| Trailing P/E Ratio | 20 |
| Expected Annual Earnings Growth | 10% |
| PEG Ratio | 2.0 |
- Step 1: Calculate EPS. Divide net income by shares outstanding: $300 million ÷ 100 million shares = $3.00 per share.
- Step 2: Calculate the P/E ratio. Divide the share price by EPS: $60 ÷ $3.00 = 20. Investors are paying 20 times BrightPath's trailing annual earnings. If BrightPath operates in the retail sector, where average P/E ratios often sit in the 15 to 20 range, this valuation looks roughly in line with its peers rather than obviously cheap or expensive.
- Step 3: Add the PEG ratio for context. The PEG ratio divides the P/E by the company's expected annual earnings growth rate. With 10% expected growth, the math is 20 ÷ 10 = 2.0. A PEG near 1.0 is often considered fairly valued relative to growth, so a PEG of 2.0 suggests the stock may be pricier than its growth rate alone would justify.
That third step is the one most beginners skip, and it's the one that catches situations where a P/E looks reasonable on the surface but doesn't hold up once growth enters the picture.
What Does a Negative P/E Ratio Mean?
A price-to-earnings ratio negative situation occurs when a company reports a net loss instead of a profit, making the EPS figure negative. When that happens, the P/E ratio stops working as a valuation tool, since dividing a share price by a negative number produces a result that doesn't reflect real value.
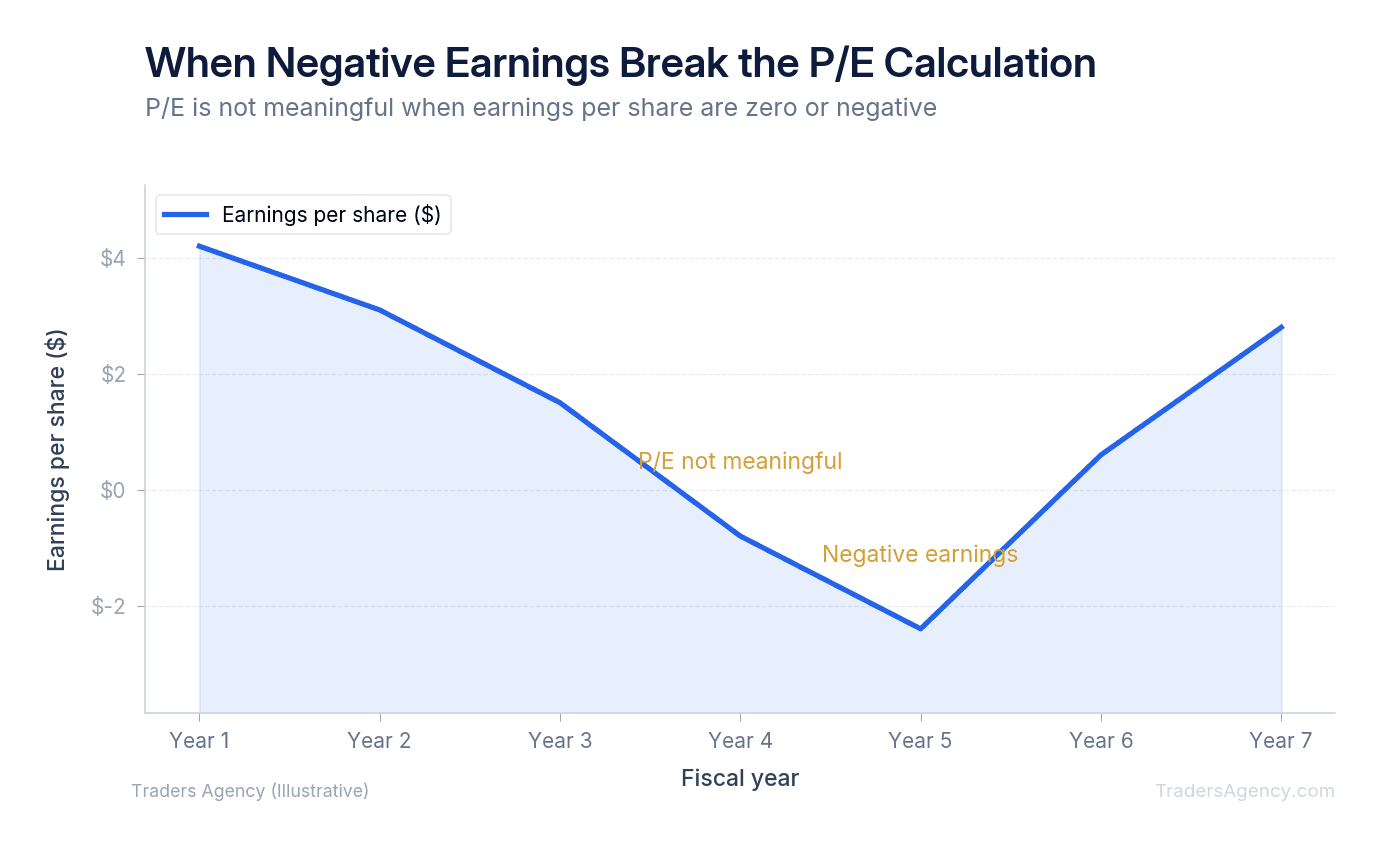
Most financial sites label this as "N/A" or "not meaningful" rather than showing a confusing negative or nonsensical positive number. It shows up most often with:
- Early-stage growth companies that are reinvesting heavily and haven't reached profitability yet
- Cyclical companies during a downturn, such as airlines or energy producers in a weak year
- Companies going through a temporary shock, like a one-time write-down or legal settlement
In these cases, we teach our members to reach for alternative metrics instead: price-to-sales ratio, price-to-book ratio, or free cash flow. Those can still be calculated even when net income is negative. The P/E ratio simply has nothing positive to divide into the share price.
Watch Out: A negative P/E is not a "cheap" P/E. If you see a stock listed with a negative or blank P/E, treat it as a signal to check the income statement before anything else.
How Do You Use the P/E Ratio in a Real Investing Decision?
Knowing the formula is one thing. Using it well is another. Here's the process we recommend to members who are new to fundamental analysis:
- Pull the trailing P/E from a screener or brokerage platform as your starting point.
- Compare it to the industry average, not the broader market, since sector norms vary widely.
- Check the forward P/E to see what growth the market is currently pricing in.
- Calculate the PEG ratio if growth estimates are available, to sanity-check whether the P/E is justified.
- Confirm the EPS number isn't inflated by one-time gains, and verify earnings aren't negative before trusting the ratio at all.
- Look at the P/E trend over several years on a price to earnings ratio chart rather than relying on a single snapshot.
When Not to Rely on P/E Alone
We never recommend making a buy or sell decision based on P/E by itself. It's a screening tool, not a complete analysis.
Skip the ratio, or weight it lightly, when a company has negative or unusually volatile earnings, when you're comparing companies across completely different sectors, or when a business just had a one-time accounting event that temporarily distorted net income. In all of those cases, the ratio can mislead you if it's the only thing you look at.
Risk Management Note
Even a stock with an attractive P/E ratio carries risk, and valuation metrics don't replace position sizing or stop-loss discipline. Our approach treats P/E as one input among several, alongside revenue trends, debt levels, and overall market conditions, before committing meaningful capital to any single position.
Watch Out: A low P/E is sometimes called a value trap for good reason. Cheap ratios often reflect real problems in the business, not a pricing mistake by the market.
Want expert trading insights delivered daily?
Join thousands of traders who rely on Traders Agency for market analysis and trade ideas.
Join Traders AgencyDISCLAIMER: Traders Agency does not offer financial advice. The information provided is for educational purposes only and should not be considered financial advice. Traders Agency is not responsible for any financial losses or consequences resulting from the use of the information provided. Trading carries inherent risks and may not be suitable for all individuals. You are advised to conduct your own research and seek personalized advice before making any investment decisions, recognizing the potential risks and rewards involved.
See more from Traders Agency on Google
Make us a preferred source and our market analysis will appear more prominently in your Google Search, Top Stories, and AI results.
Add to Preferred Sources