
Ross here.
My gold price forecast hasn't changed just because the price has. Gold sits 22% below its January high, central banks are buying every single month, and retail money keeps pouring into ETFs while the price slides. That combination has an expiration date. Either the buyers quit, or the price catches up to them. I don't think the buyers are quitting.
The setup looks almost identical to 1976, the last time gold pulled back this hard inside a bull market. What followed was an 8x move over four years. If you sold your gold in this pullback, or never bought any, this is your second chance.
Why Did Gold Rise After The Fed Raised Rates?
Bottom Line: Gold's pullback looks like the 1976 setup that preceded an 8x rally over four years, not a sign the bull market is over. As long as gold holds above $4,000, dips are treated as buying opportunities; a break below that line would call the whole thesis into question.
The textbook said one thing. The market did the opposite.
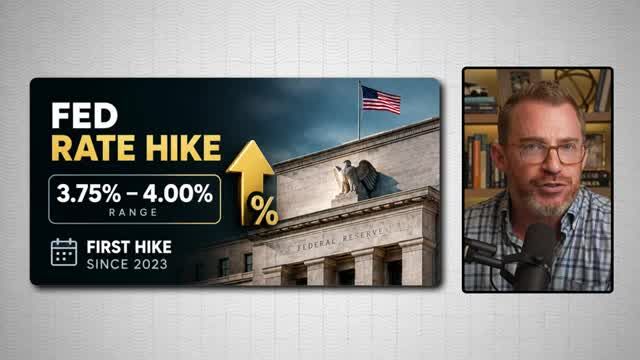
Last week the Federal Reserve raised its benchmark rate a quarter point to a range of three and three quarter to four percent. First hike since 2023. Their own forecast says one more is coming before year end.
Every financial textbook says that's bad for gold. Gold doesn't pay interest, so when cash suddenly does, gold is supposed to lose.
Gold futures closed up 1.25% that day instead.
Here's why the textbook broke: inflation isn't beaten. August CPI came in at 3.4%. Gasoline is up 27% from a year ago. Diesel just hit an all-time record thanks to the Iran conflict. Kevin Wurst, the new Fed chair, said it himself: 65 months of elevated inflation. That's five and a half years running.
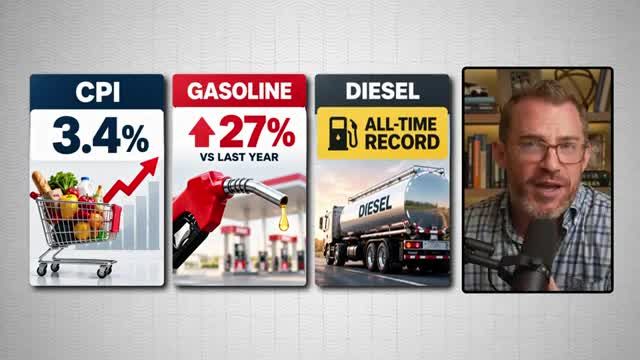
A quarter point hike against 3.4% inflation isn't aggressive action. It's barely a warning shot. That's why the gold market didn't flinch.
Who Is Buying Every Ounce Of Gold Investors Sell?
Start with the biggest buyer on earth.
China's central bank has bought gold every single month since late 2024, and the pace is accelerating. Twenty tons in August alone, and China notoriously under-reports its purchases. Gold is now 9% of China's foreign reserves.
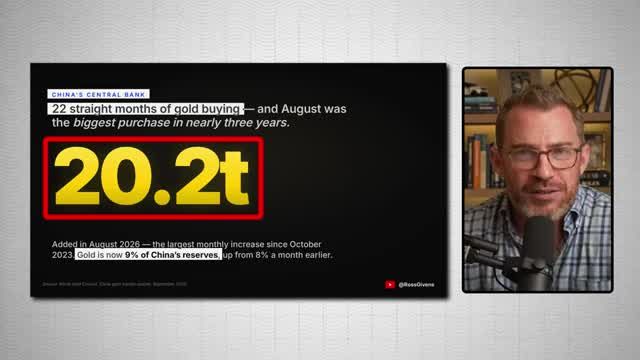
They're swapping U.S. treasuries for gold bars, and they don't care what the price is. They were buying near $5,600 in January. They were buying in the low $4,000s in August. They aren't trading it. They're buying it and replacing the dollar with it.
And it isn't just China.
- Central banks bought 289 tons of gold in the second quarter, the biggest second quarter the World Gold Council has ever recorded
- Poland bought 51 tons and says it's on its way to 700 tons
- Uzbekistan and Kazakhstan, countries you never think about, are quietly filling their vaults
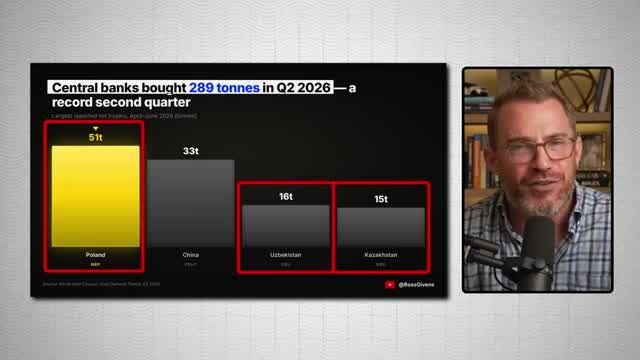
Why now? These governments watched the United States freeze Russia's dollar reserves in 2022 and drew the logical conclusion. Treasuries can be switched off. Gold can't.
The World Gold Council surveys the world's central banks every year. This year a record 45% said they plan to add to their own gold in the next 12 months. Not hold it. Add to it.
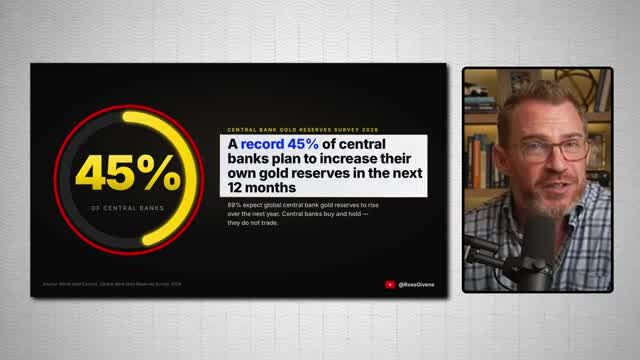
A central bank doesn't buy gold on Monday and sell it Friday. They buy it and it disappears into a vault for 30 years.
Retail Is Piling In Too
Gold ETF holdings and the price of gold moved together for five months. In mid-August, they split. Investors kept piling in anyway. Holdings are back to about 100 million ounces with eight straight days of inflows, the longest recent stretch, while the price went the other way.
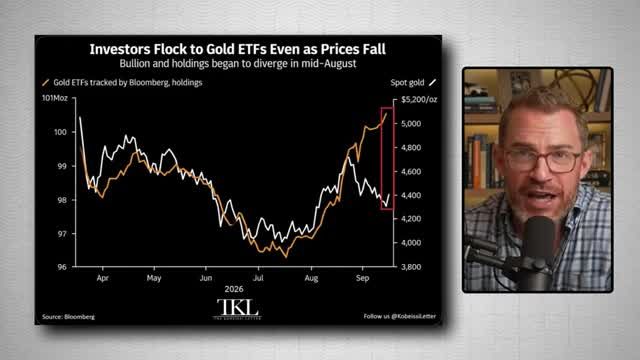
Central banks are buying. Retail is buying. The only thing not going up is the price.
That does not last. Either the buyers quit, and 22 straight months of Chinese purchases says they won't, or the price catches up.
Get an entire year of live weekly mentoring sessions, my newsletter, indicators, bonus reports, tons more. Click the link and I'll see you in the next live session.
Join my Black Ops Trading ClubGold Hedges Money, Not CPI
Why not just sit in cash and earn a steady 4%?
Because gold isn't really an inflation hedge, even though that's what everybody calls it. It's something better. It's a hedge against the money supply.
The World Gold Council ran the numbers back to 1971, when Nixon took the U.S. off the gold standard. Gold barely tracks the Consumer Price Index. What it tracks, almost perfectly, is the amount of money in the system.
Is Gold's Current Pullback Like The 1976 Setup?
In the 1970s, the last time America had a real inflation problem like today, gold ran from $35 to $195 by the end of 1974. Then it fell nearly in half. Two years of pain. Everyone said the gold trade was over.
By August 1976, gold sat at $103 an ounce. Then it went to $850. More than 8x in under four years.
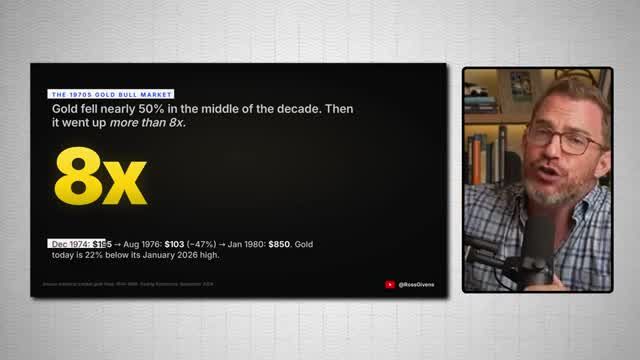
Gold today is 22% off its highs, inside a bull market driven by central banks that have told you directly in surveys they plan to keep buying. This isn't a warning sign. It isn't over. It's an opportunity.
Miners Have Never Been This Cheap
Gold miners are trading at about 15 times earnings while their cost to dig up an ounce is less than 40% of the price they sell it for. Five years ago that ratio was 64%. These companies have never been this profitable.
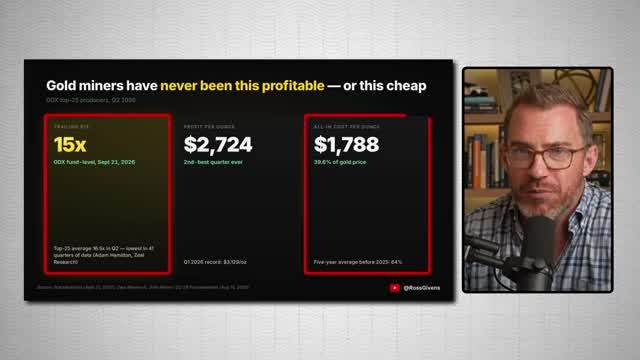
Last quarter, the biggest miners cleared roughly $2,700 of profit on every single ounce they pulled out of the ground. Adam Hamilton, an analyst at Zeal Research, has tracked the 25 largest gold miners every quarter for over a decade. He says he's never seen them this cheap, and across 41 straight quarters of data the valuation has never been lower.
Gold fell 20 to 25% this year, but the miners are still making near record money because their costs didn't rise the way the price of gold rose. If gold goes back to its January high, that $2,700 an ounce becomes $3,800.
The stocks don't go up a little. They go up a heck of a lot more than that.
GDX: The Leveraged Gold Trade
The easiest way to trade this is GDX, the VanEck Gold Miners ETF. It owns Newmont, Agnico Eagle, and Barrick all in one ticker. It's currently trading in the mid $90s per share, about 20% under its high from earlier this year, and it just had its biggest August in decades.
Overlay gold futures on GDX and the relationship is obvious. When gold goes up, miners go up. When gold goes down, miners go down. But the downside move isn't the extreme it used to be, because profits are so high the group can print money sitting right here.
Know what you're signing up for. If gold tanks, GDX tanks harder.
But with a bull market in gold, low average inflation, and these stocks at bargain basement prices, GDX is one of the best long-term investments available right now. The basket gives you all of them, so you aren't exposed to any single stock.
Does Silver Come Along?
Yes, but not in a straight line.
Silver fell twice as hard as gold in the pullback, down 45% from its high versus gold's 22%. It's a smaller market that makes bigger swings, and roughly half its demand is industrial, so it needs the economy working, not just central banks buying.
The other side of that coin: silver is still up more than 50% over the last 12 months while gold is up 16%. Usually when gold moves, silver moves further. It just makes you sweat more along the way.
My Gold Price Forecast: $4,000 and $5,600
Gold's line in the sand is about $4,000 an ounce. That's this year's low, and it's the line I gave back in August. Above it, this is a pullback inside a bull market and every dip is a gift. Below it, something changed. The central banks stopped, or the Fed got serious, and the thesis is wrong.
- $4,000: this year's low, the level that would have to break to worry me
- $5,000: Wall Street's current target, and where the Kobesi letter says price should sit if it simply catches up to ETF holdings
- $5,600: this year's high, and my target for the first half of 2027
My gold price forecast treats $5,000 as the floor, not the ceiling. I think gold is back at $5,600 in the first half of 2027 and much higher by year end. And with 45% of the world's central banks telling you directly they're buying, I still think this is $10,000 an ounce gold inside the next two to three years.
Where This Goes From Here
Central banks are buying, retail is buying, and the price still hasn't caught up. That gap doesn't close by the price falling further. It closes by the price rising to meet the demand.
The 1976 comparison isn't a throwaway line. Gold fell nearly in half in the mid-1970s, everyone called the trade dead, and it ran more than 8x over the next four years. Today's 22% pullback from the January high looks a lot like that setup, backed by 22 straight months of Chinese buying, a record 289 tons of central bank purchases in a single quarter, and 45% of central banks saying they'll buy more.
My gold price forecast still hinges on that $4,000 line. Above it, every dip is an opportunity. Below it, I rethink the whole thesis. Until then, I'm watching GDX for leveraged exposure to miner profitability, keeping an eye on silver's wider swings, and treating this second chance exactly like what it is: an entry point, not a warning sign.
Get an entire year of live weekly mentoring sessions, my newsletter, indicators, bonus reports, tons more. Click the link and I'll see you in the next live session.
DISCLAIMER: Traders Agency does not offer financial advice. The information provided is for educational purposes only and should not be considered financial advice. Traders Agency is not responsible for any financial losses or consequences resulting from the use of the information provided. Trading carries inherent risks and may not be suitable for all individuals. You are advised to conduct your own research and seek personalized advice before making any investment decisions, recognizing the potential risks and rewards involved.
See more from Traders Agency on Google
Make us a preferred source and our market analysis will appear more prominently in your Google Search, Top Stories, and AI results.
Add to Preferred Sources