Hey, Ross here:
Election Day is here.
By tonight, we’ll have plenty of people telling us what the results mean for stocks.
Before all that starts, I want to show you two charts worth keeping in mind.
Chart of the Day
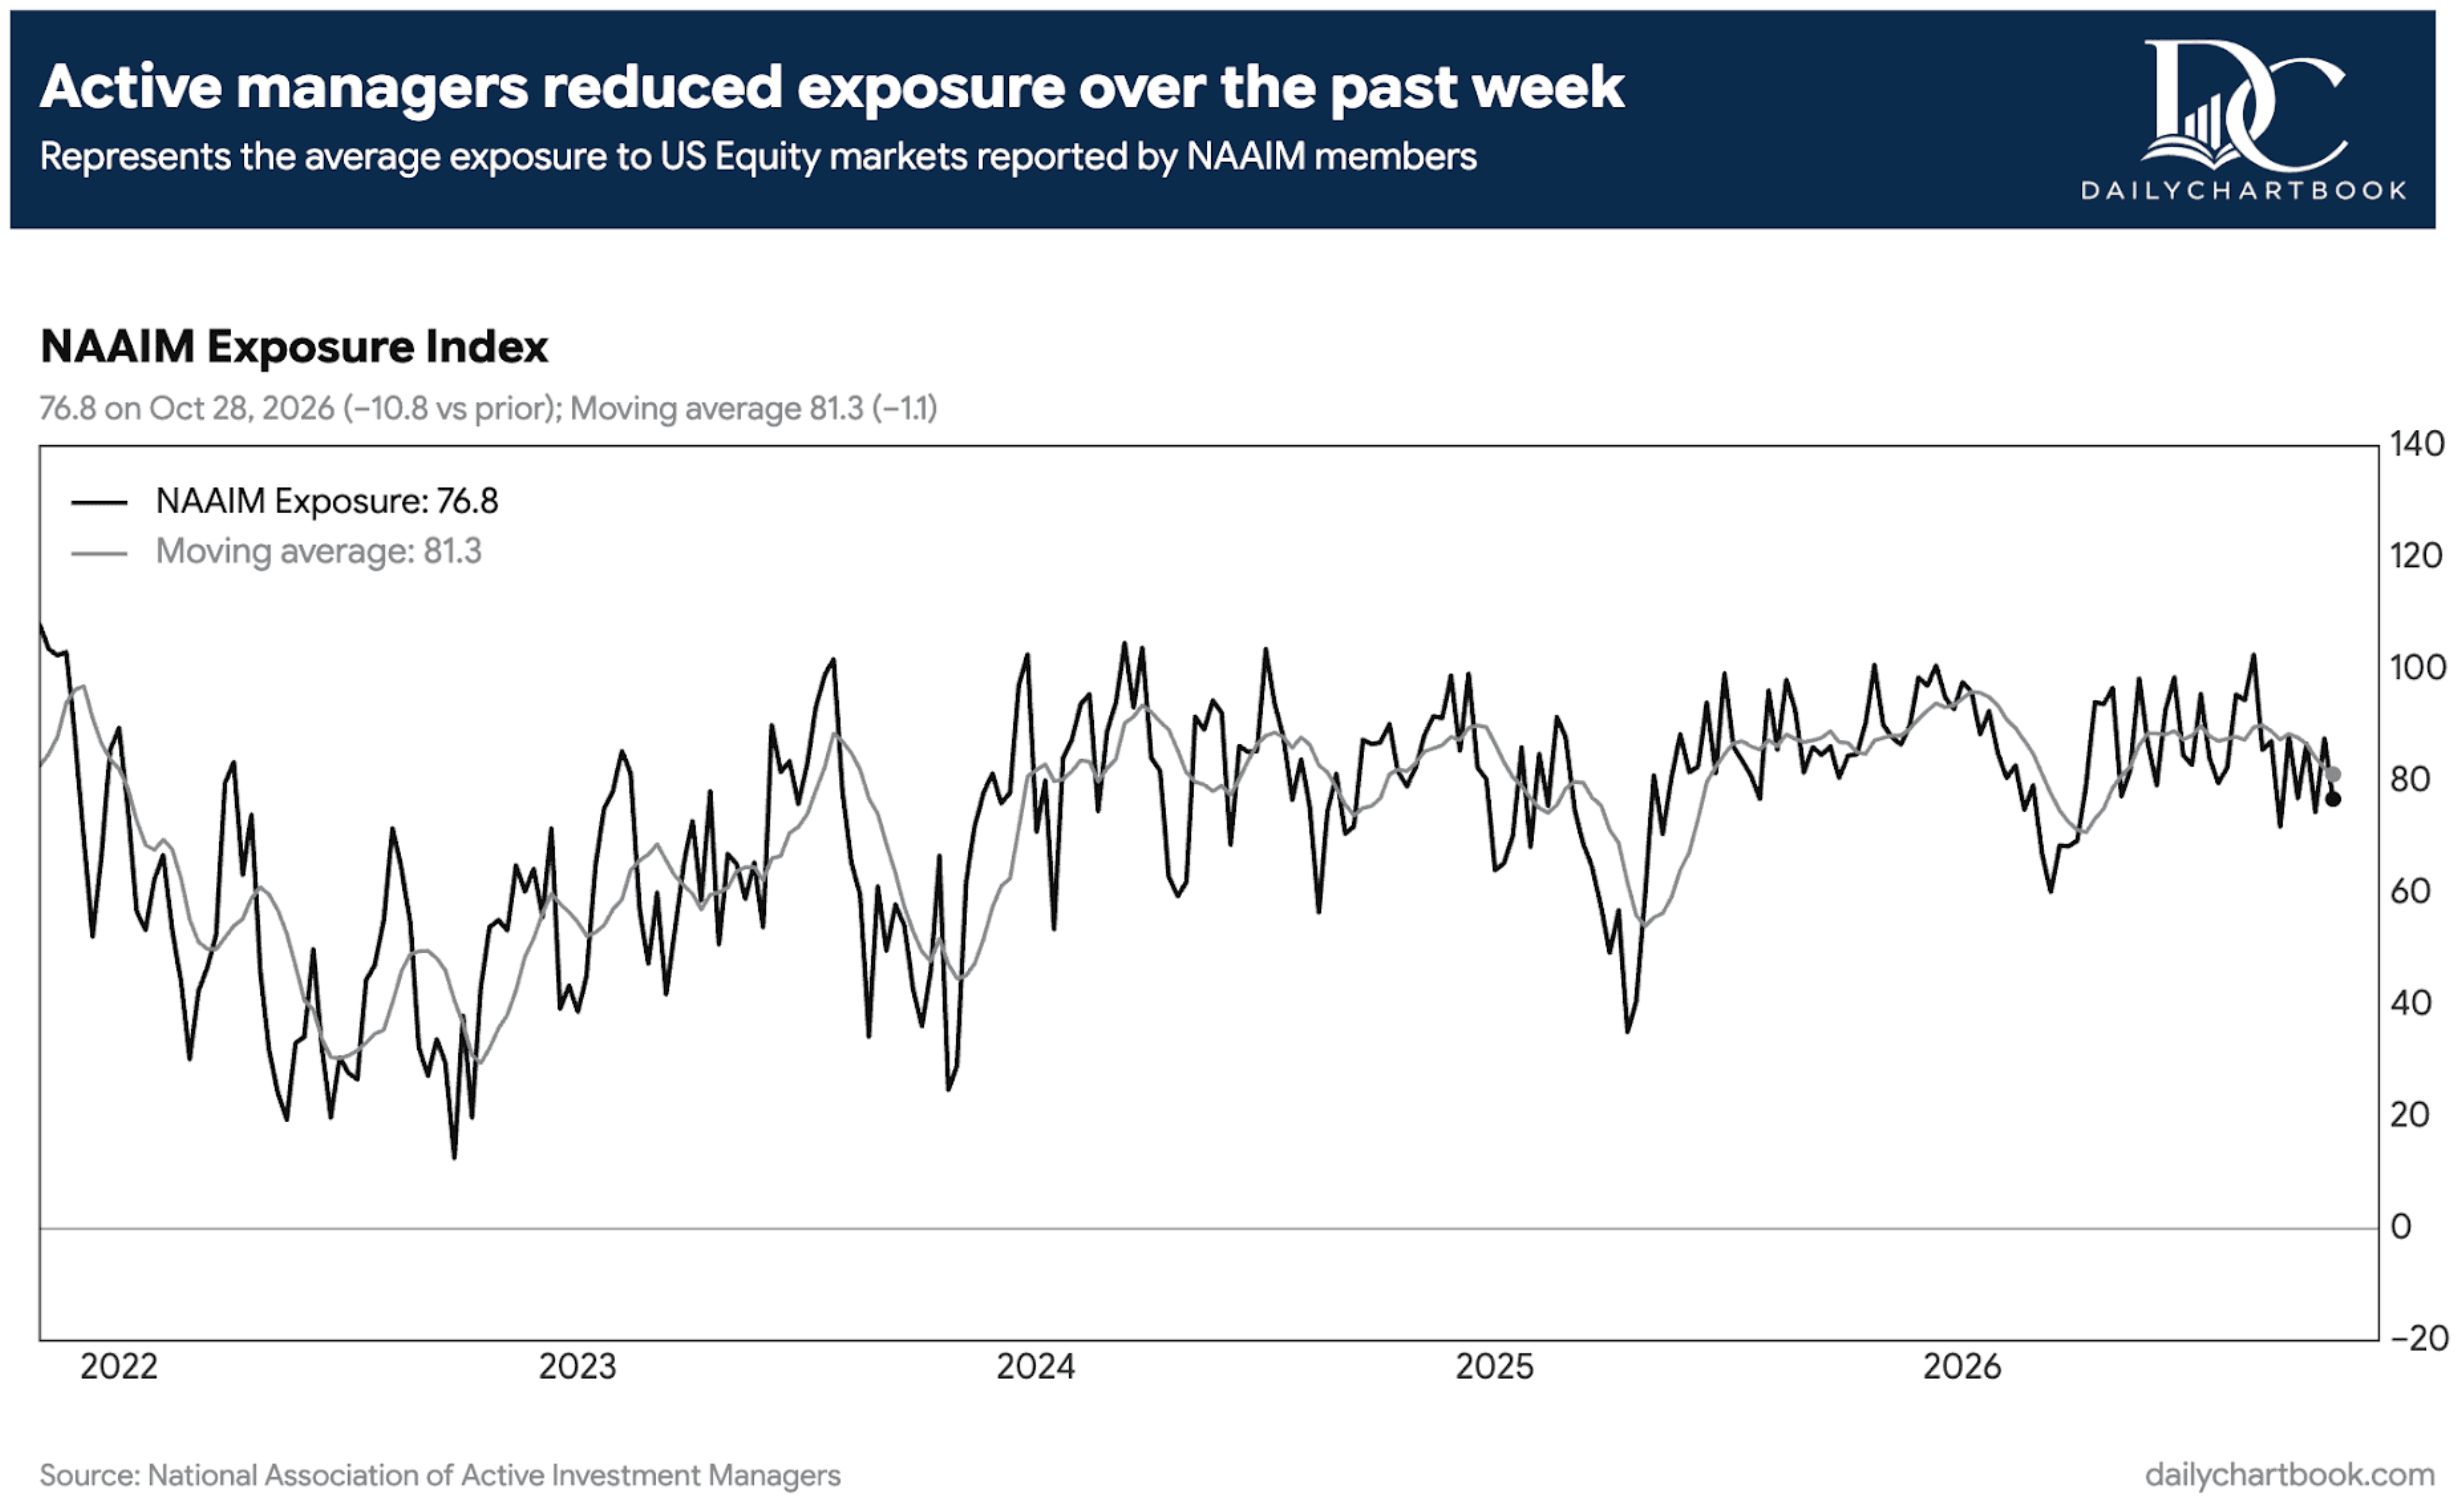
This chart tracks how much stock market exposure active investment managers – aka the big institutional investors – report holding.
The black line is the weekly reading.
When the lines fall, these managers are taking less stock market risk.
Look at the right edge. The black line keeps swinging up and down.
That means the “smart money” is jumping in and out – adding to stock positions one week, then cutting back the next.
Now put that back-and-forth next to this:
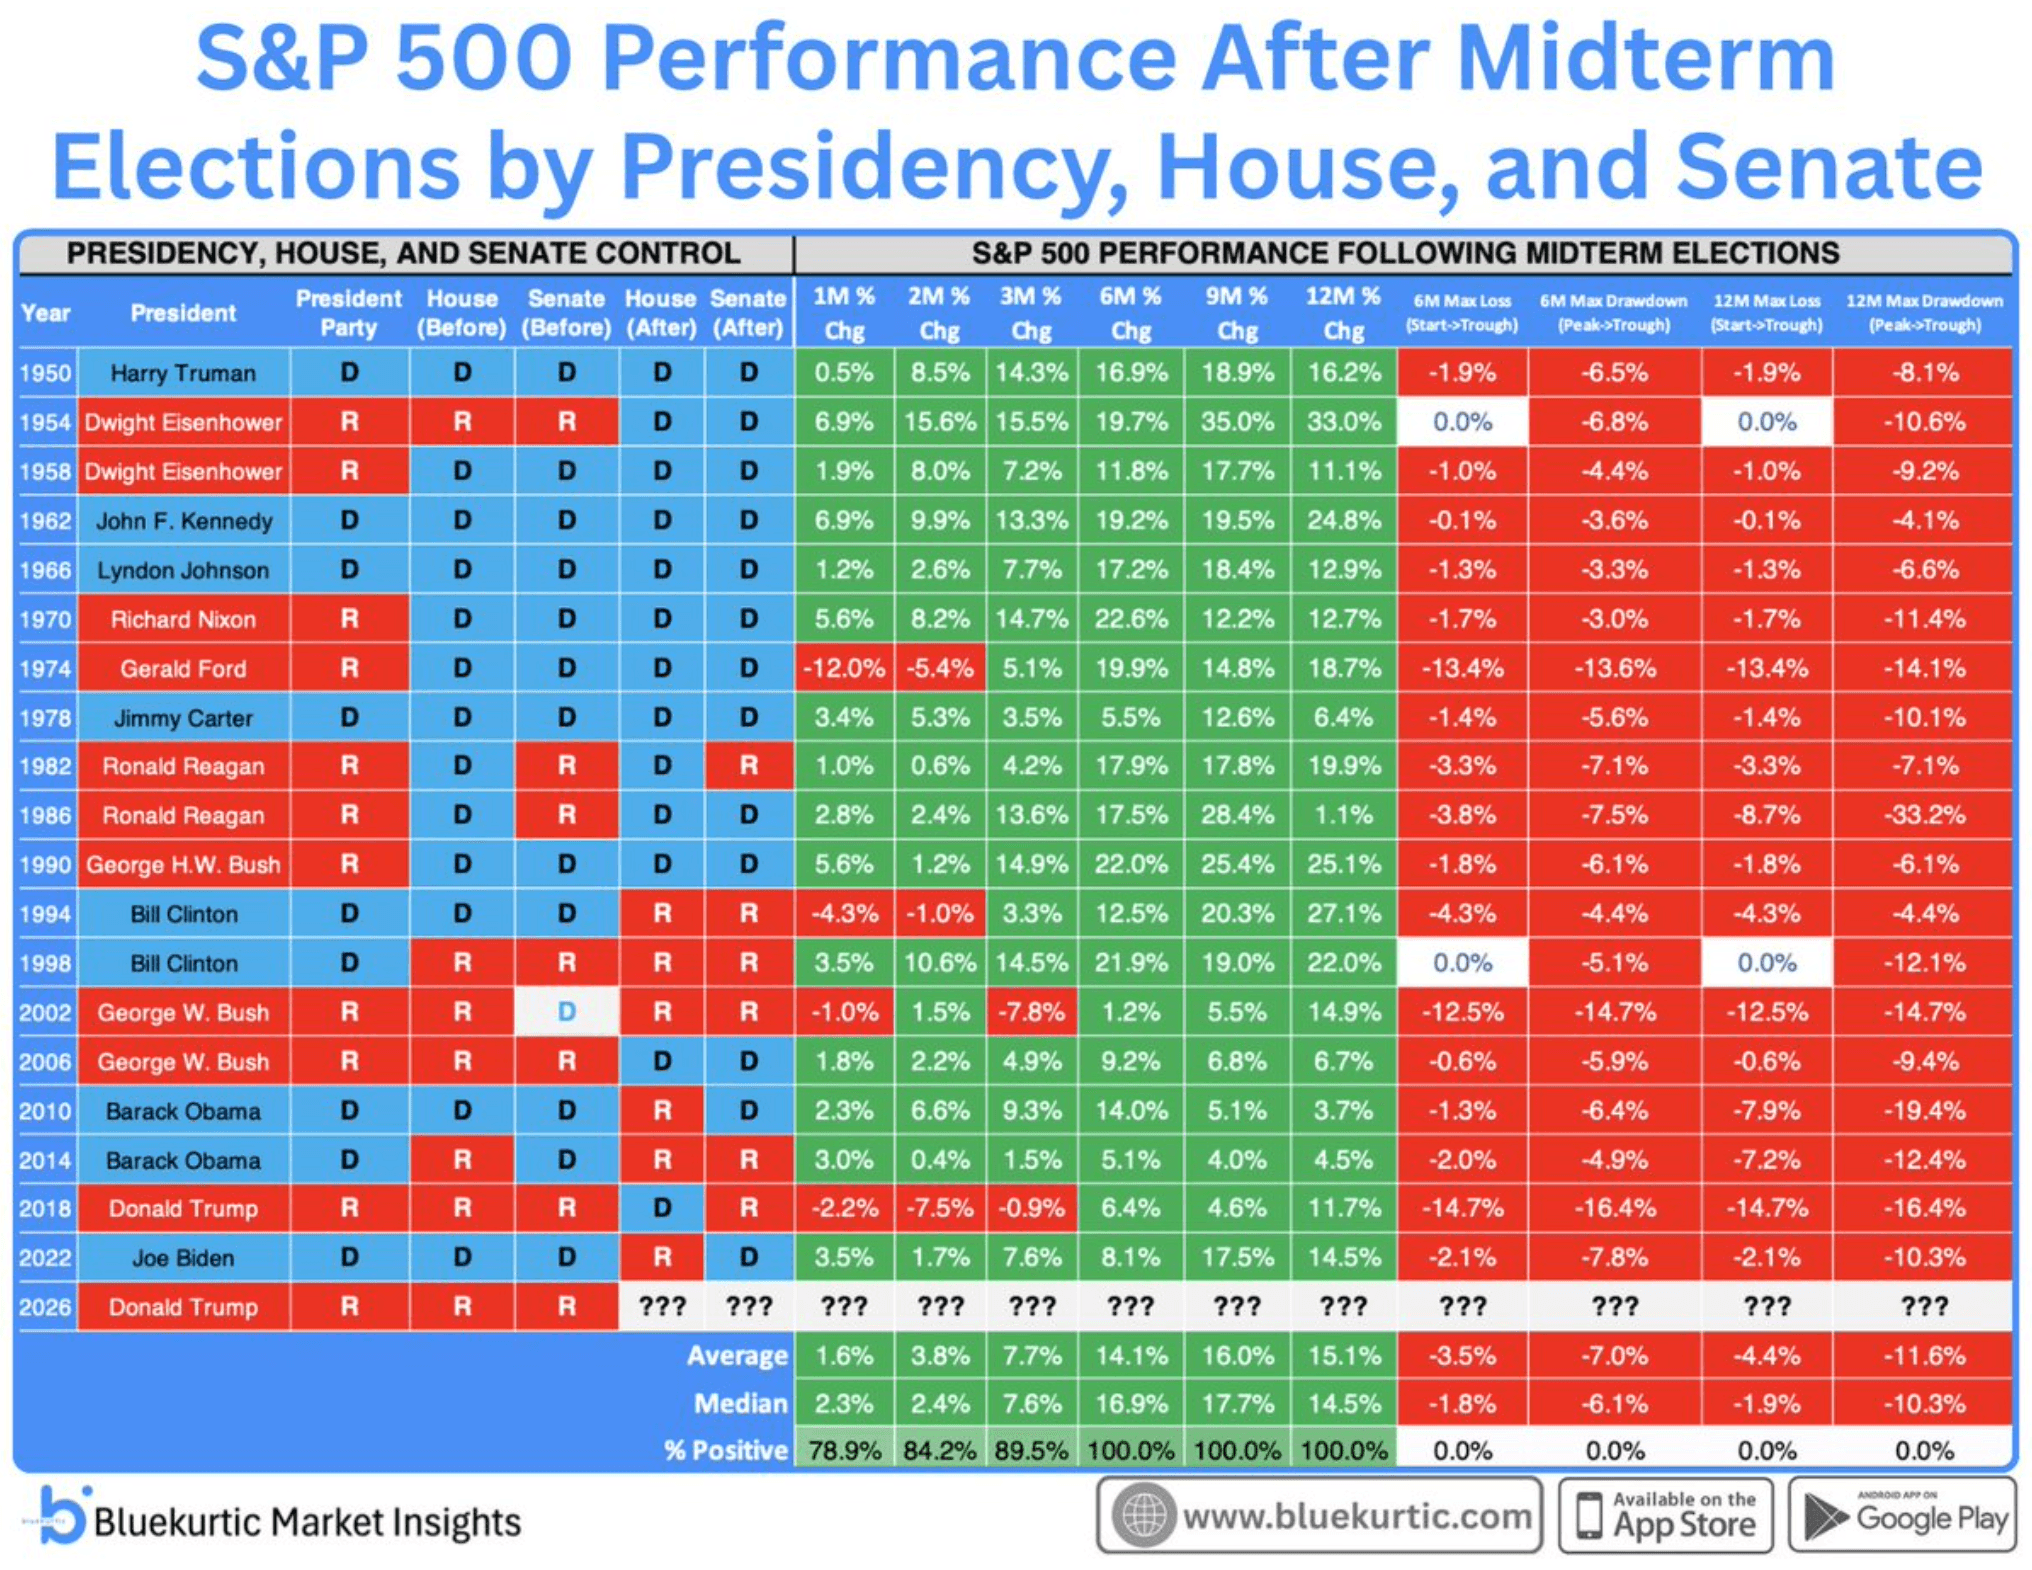
This table shows S&P 500 returns after every midterm election since 1950.
Look at “6M % Chg.” All 19 results are green, with an average gain of 14.1% – despite the losses along the way shown in red on the right.
That means that stocks can pull back right after the election…
And still end up significantly higher six months from now.
That’s a bullish backdrop, even with fund managers still jumping in and out.
But I’m not waiting for them to settle on a market outlook.
I’m looking for the stocks they’re already buying.
Insight of the Day
You don’t need everyone to turn bullish before you find a good trade.
I’m still looking to put new money to work.
The recent selling in big tech hasn’t changed that. Plenty of stocks outside those crowded names are holding up, and I want to find the ones drawing fresh buyers.
But a bullish view of the next six months isn’t enough to buy a stock today.
That’s where traders get into trouble.
They decide the market should rise, grab a familiar name, and assume it will come along for the ride.
Then the market goes up without them.
A good outlook and a good trade are two different things.
Similarly, a bad outlook doesn’t necessarily mean a bad trade.
The funds buying healthcare don’t need to wait for the funds selling tech.
They can keep building those positions while the headlines still make the whole market sound like a disaster.
I want to follow that buying before the rest of Wall Street catches on.
If you want to see how I spot that buying, join me LIVE in just a few hours today at 11 a.m. Eastern.
I’ll show you how I follow the money flowing into individual stocks – and the signs that tell me a large buyer may be building a position.
We’ve used this approach to identify stock moves like 77% in 21 days, 51% in 15 days and even 87% in 24 hours.
I’ll walk through what I’m watching now, plus an election-day special I’ve put together for this session.
You don’t have to wait for tonight’s results to attend.
Click here to save your free seat and join me today at 11 a.m. ET.
P.S. If you’re planning to attend on a mobile device, make sure you download the presentation app now so you don’t miss anything when it starts. See you there.
iOS: apps.apple.com/us/app/goto/id1465614785
Android: play.google.com/store/search?q=goto&c=apps
Customer Story of the Day
"I've learned more about the stock market and smart investing from Ross than all other newsletters combined.
It's because he puts everything in easy to understand terms and is thorough."
Embrace the surge,

Ross Givens
See more from Traders Agency on Google
Make us a preferred source and our market analysis will appear more prominently in your Google Search, Top Stories, and AI results.
Add to Preferred Sources