If you’ve seen me break down price action before, you know I like to look for consolidation patterns after uptrends.
This is where after a stock has run up significantly…
It consolidates – often in a classic “shallowing” pattern – for a time as markets digest the move.
Only once this move has been fully digested can the stock break higher after.
For today, let’s look at a major consolidation pattern that’s formed – in the most-watched stock index of all time.
Chart of the Day
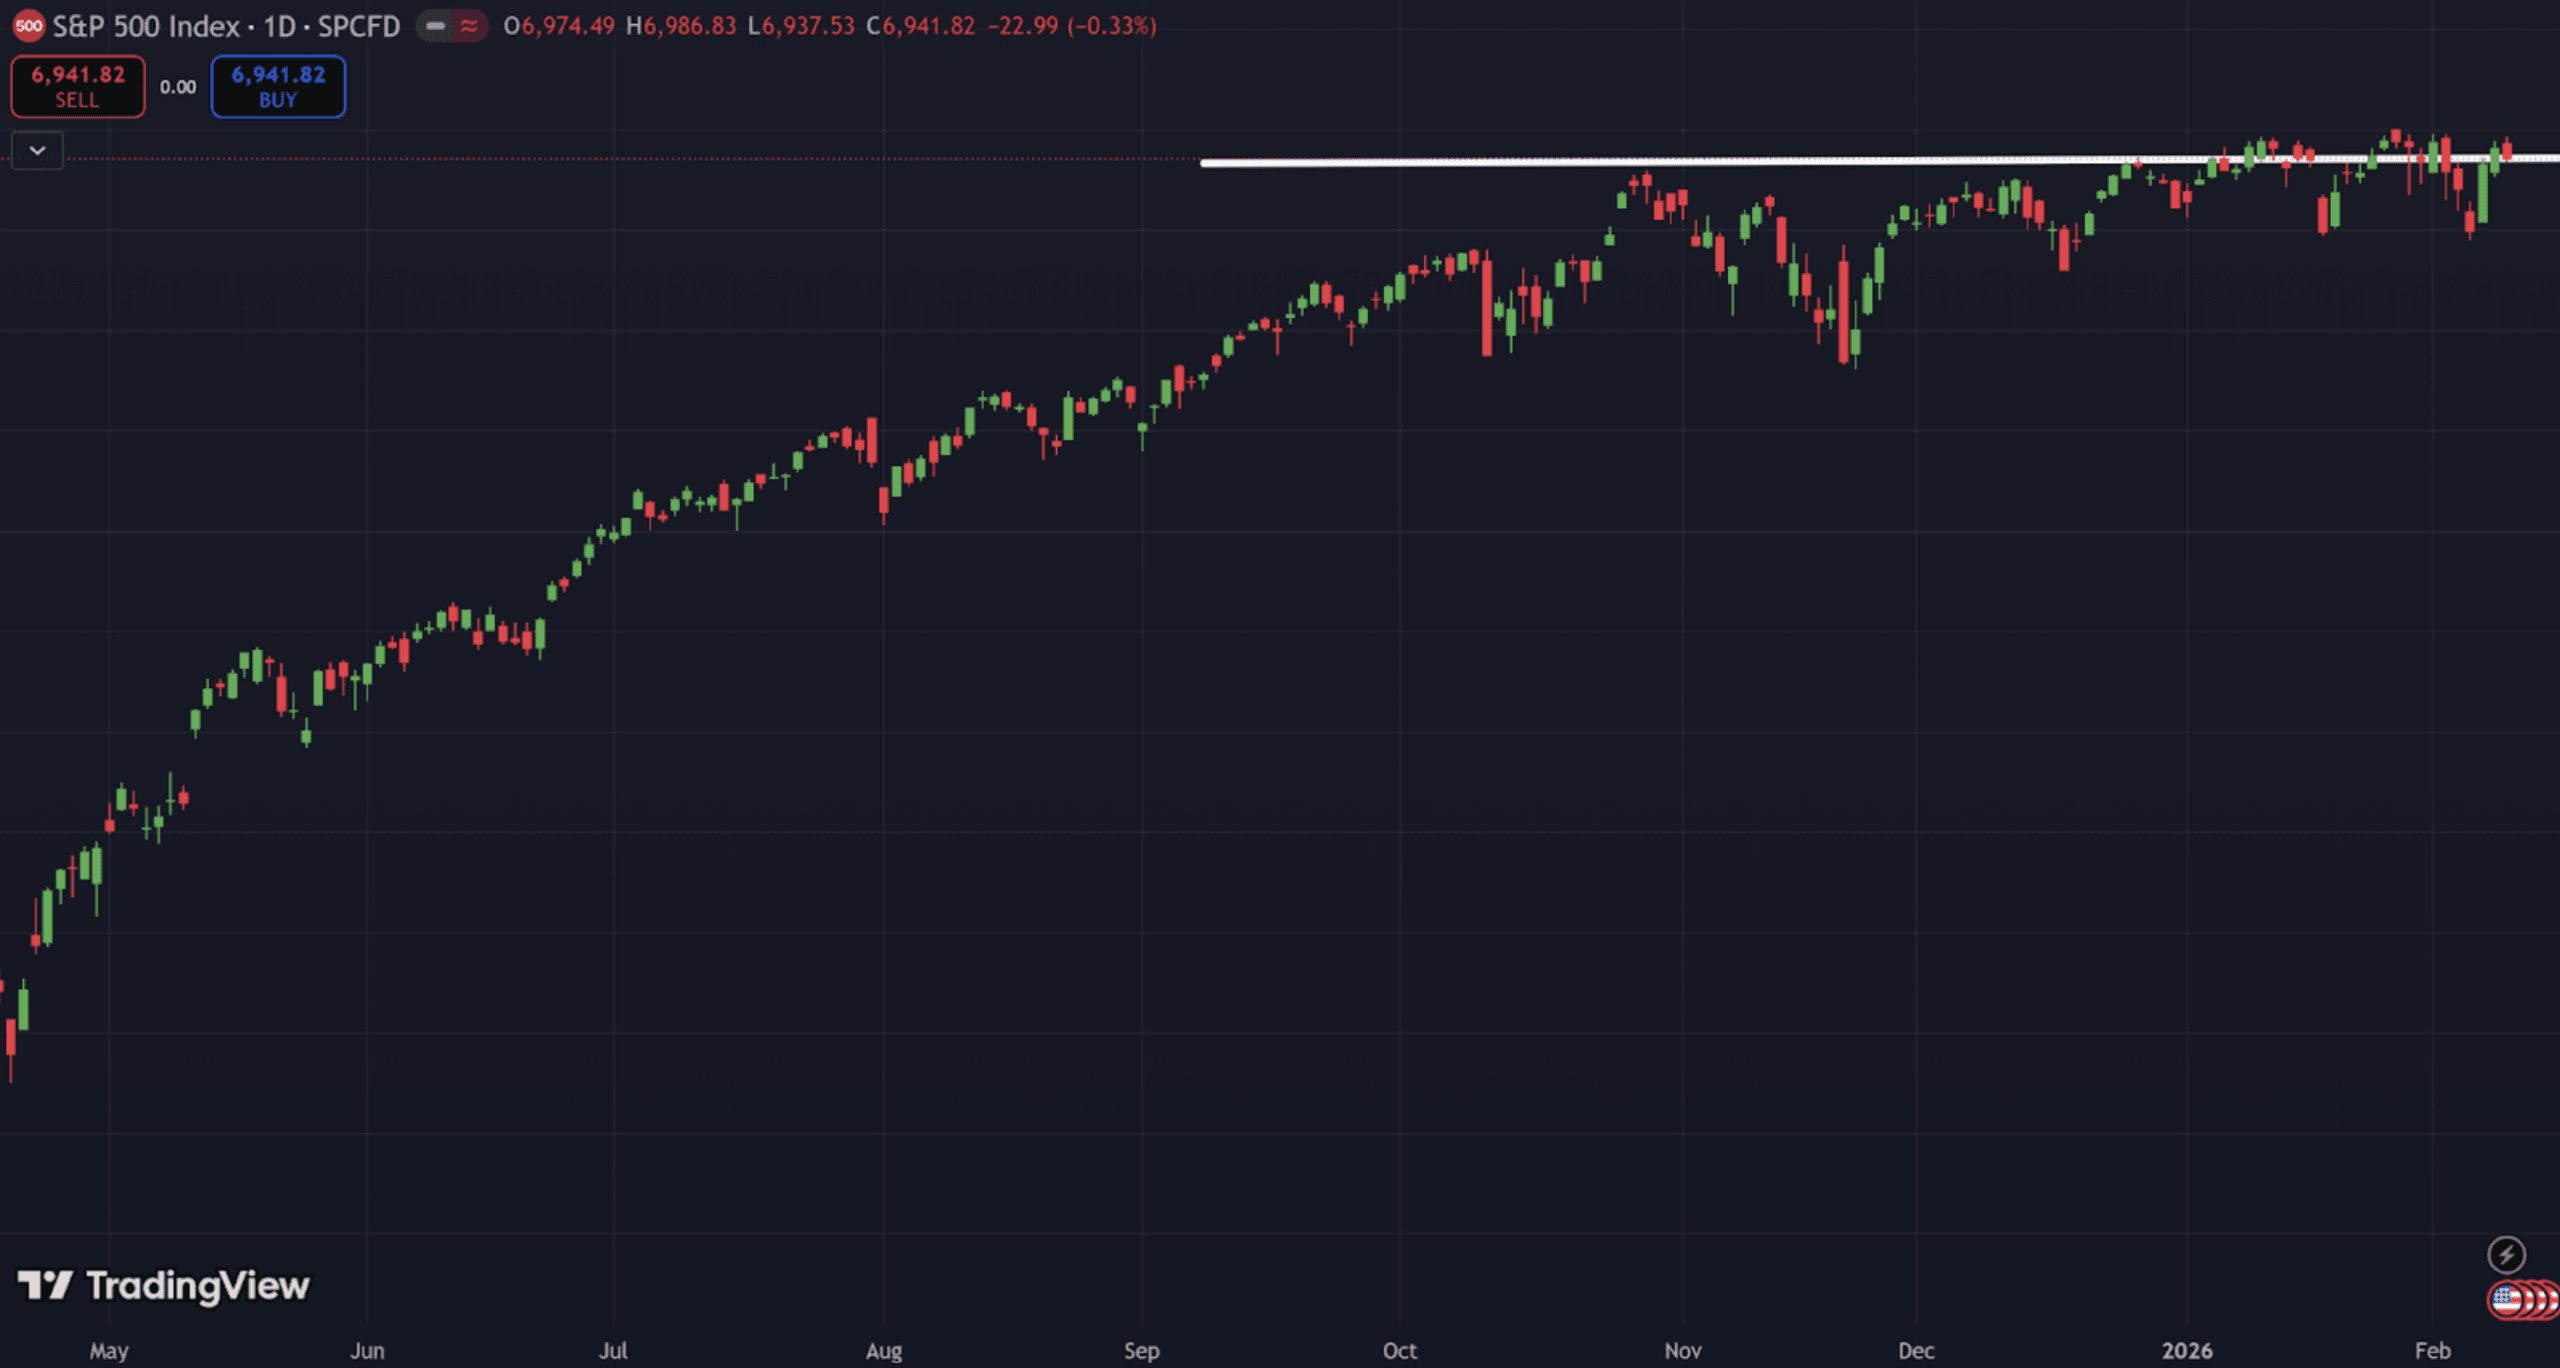
This is the S&P 500, which is still trading below its end-October highs.
Those highs have formed a clear resistance level, which the index attempted to break (but failed to) around Christmas.
To some that may be a negative sign.
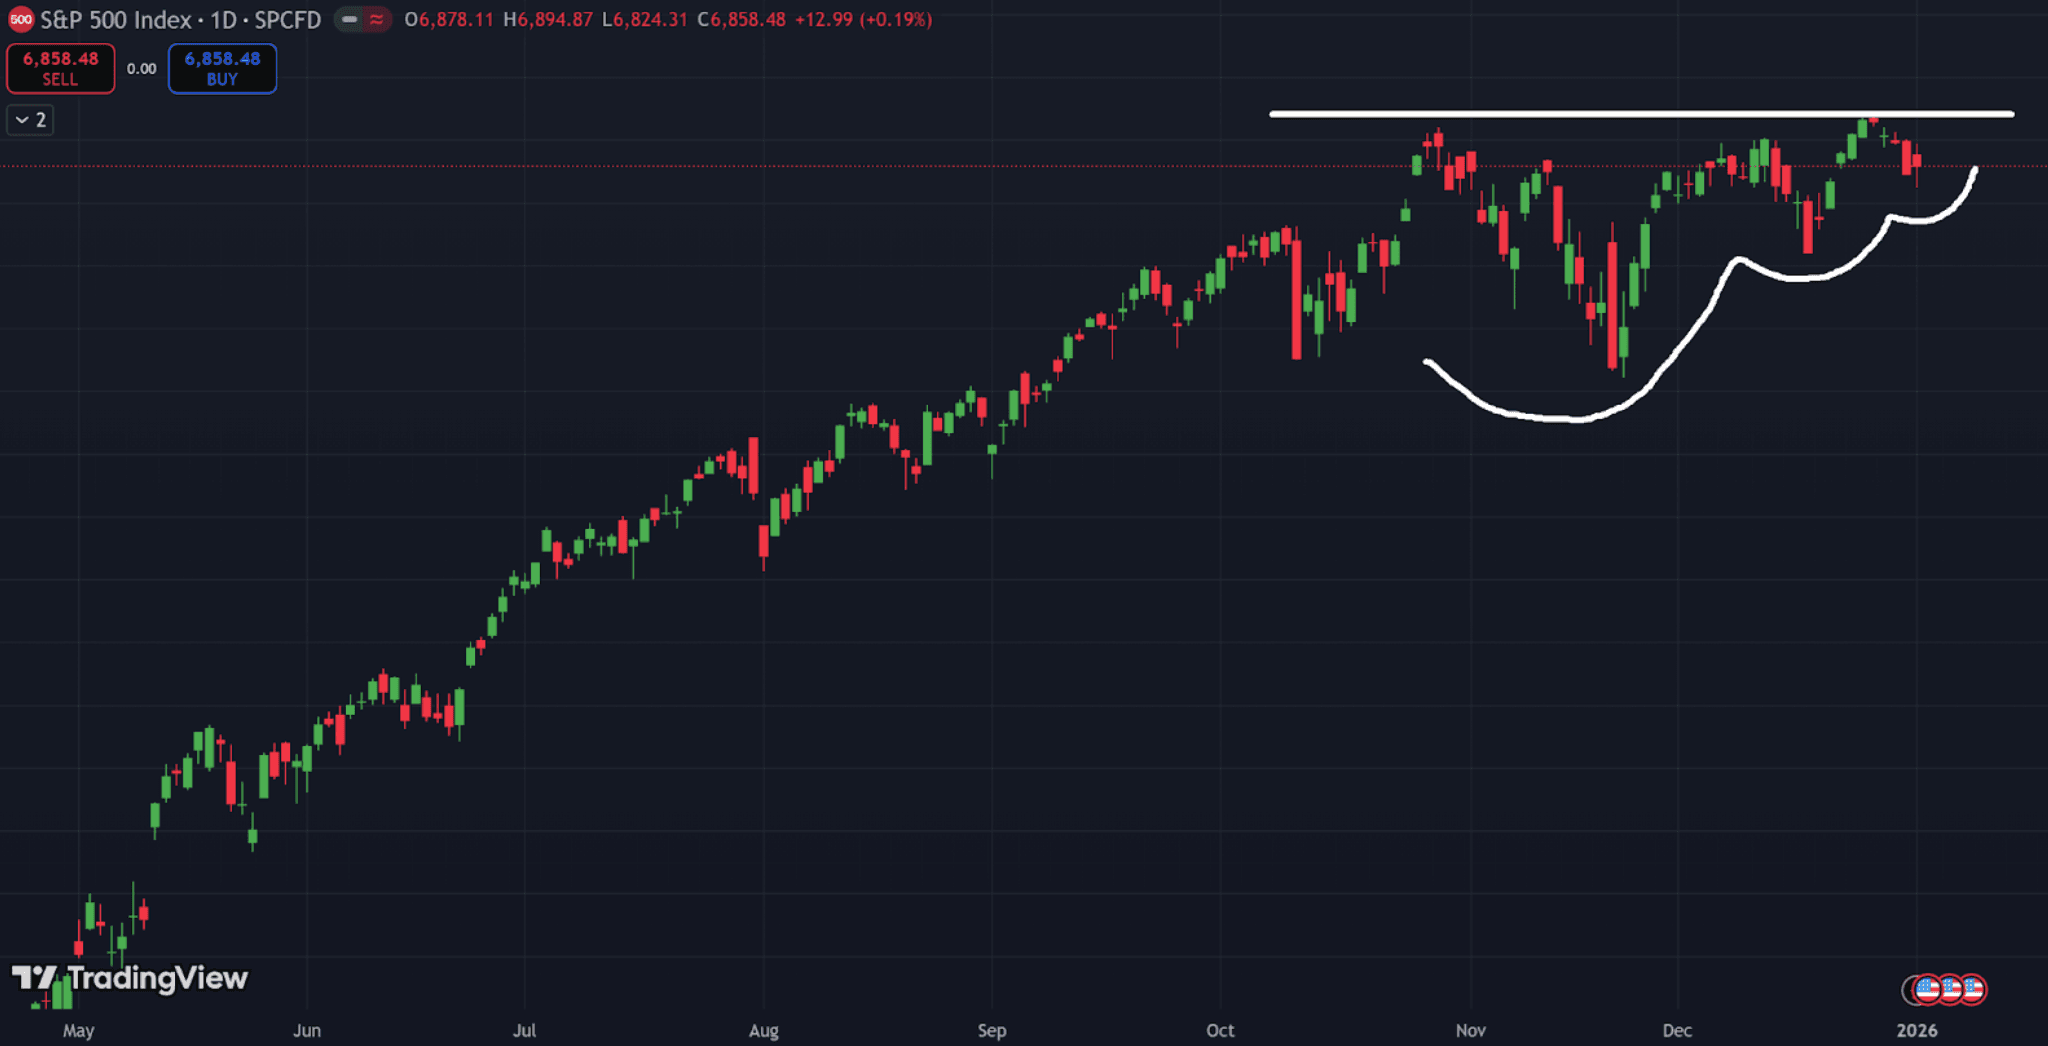
But if you look at the chart above, you can see that each dip – including the one over the past few trading days – has been following a classic shallowing pattern of “higher lows”.
That’s a classic shallowing pattern – and exactly what we want to see.
And here’s another interesting data point.
If you look at the closing price for the S&P 500 in end-October, end-November, and end-December…
You’ll find that they’re all within 1% of each other (I’ve highlighted it on the chart below).
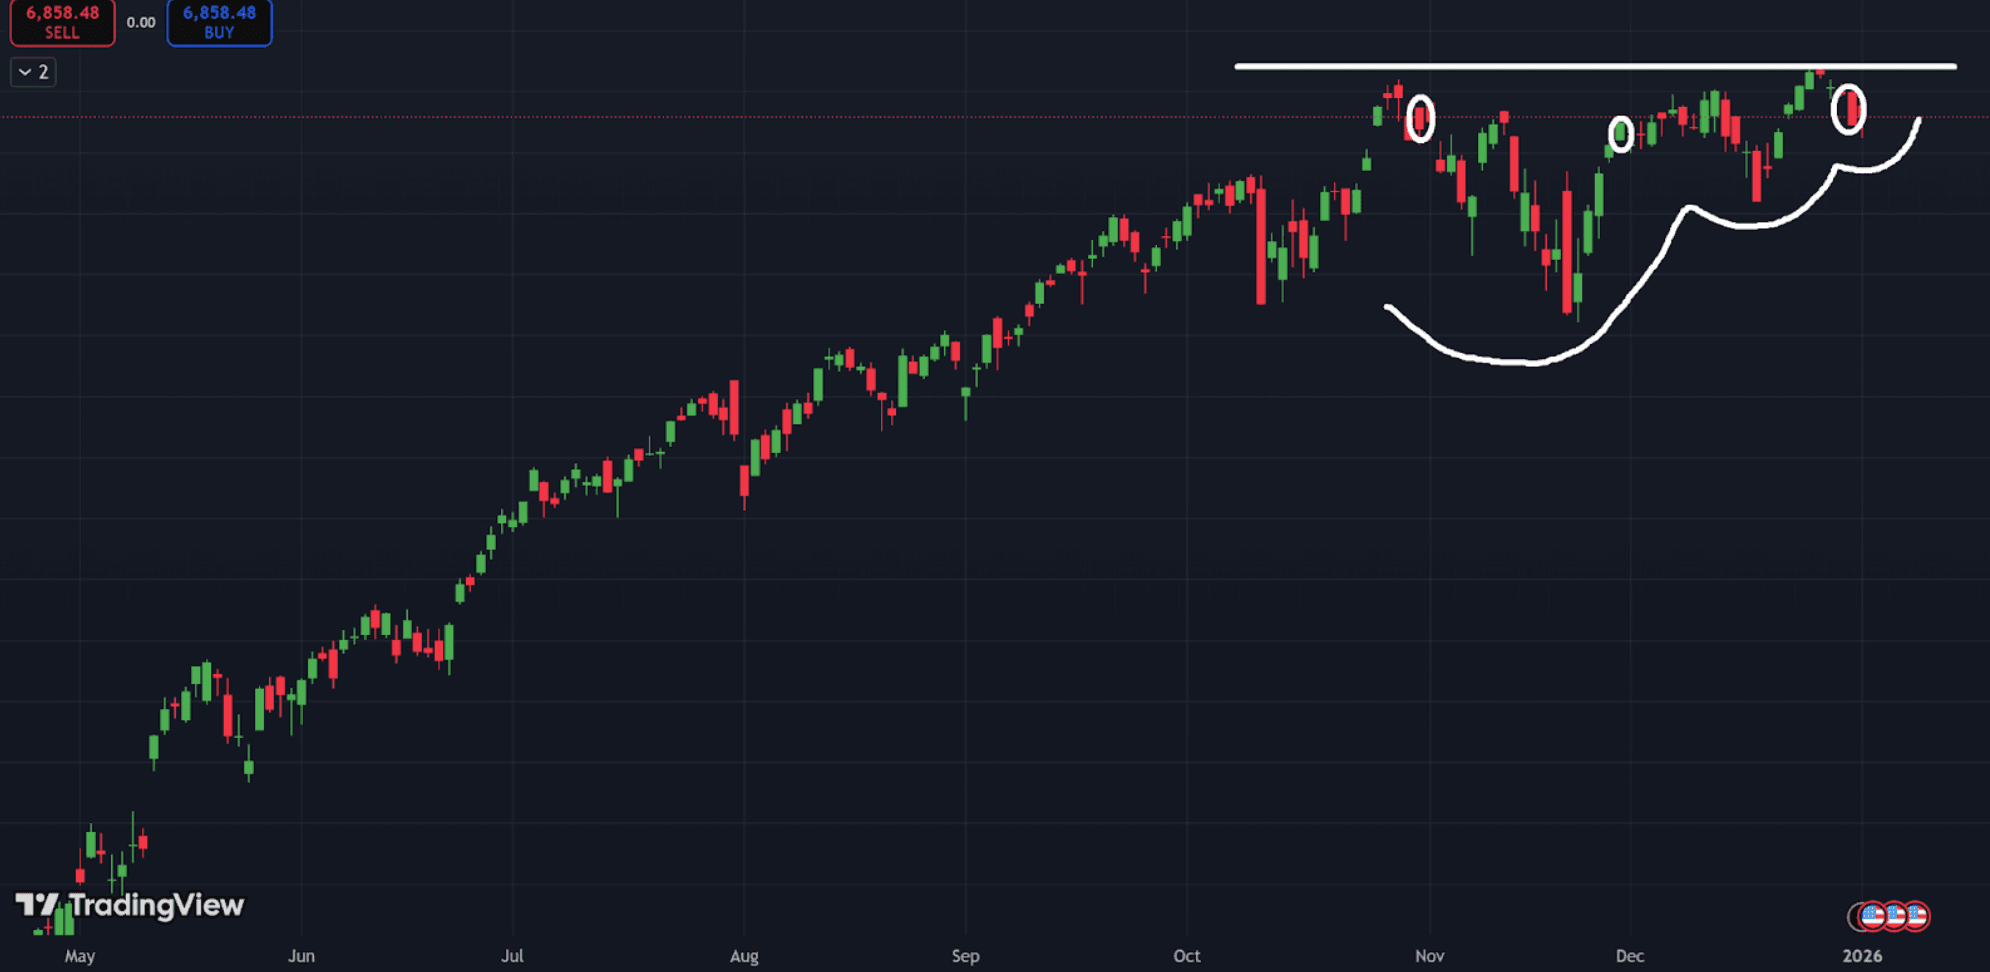
And historically, when that happens – it’s usually a positive sign for the markets.
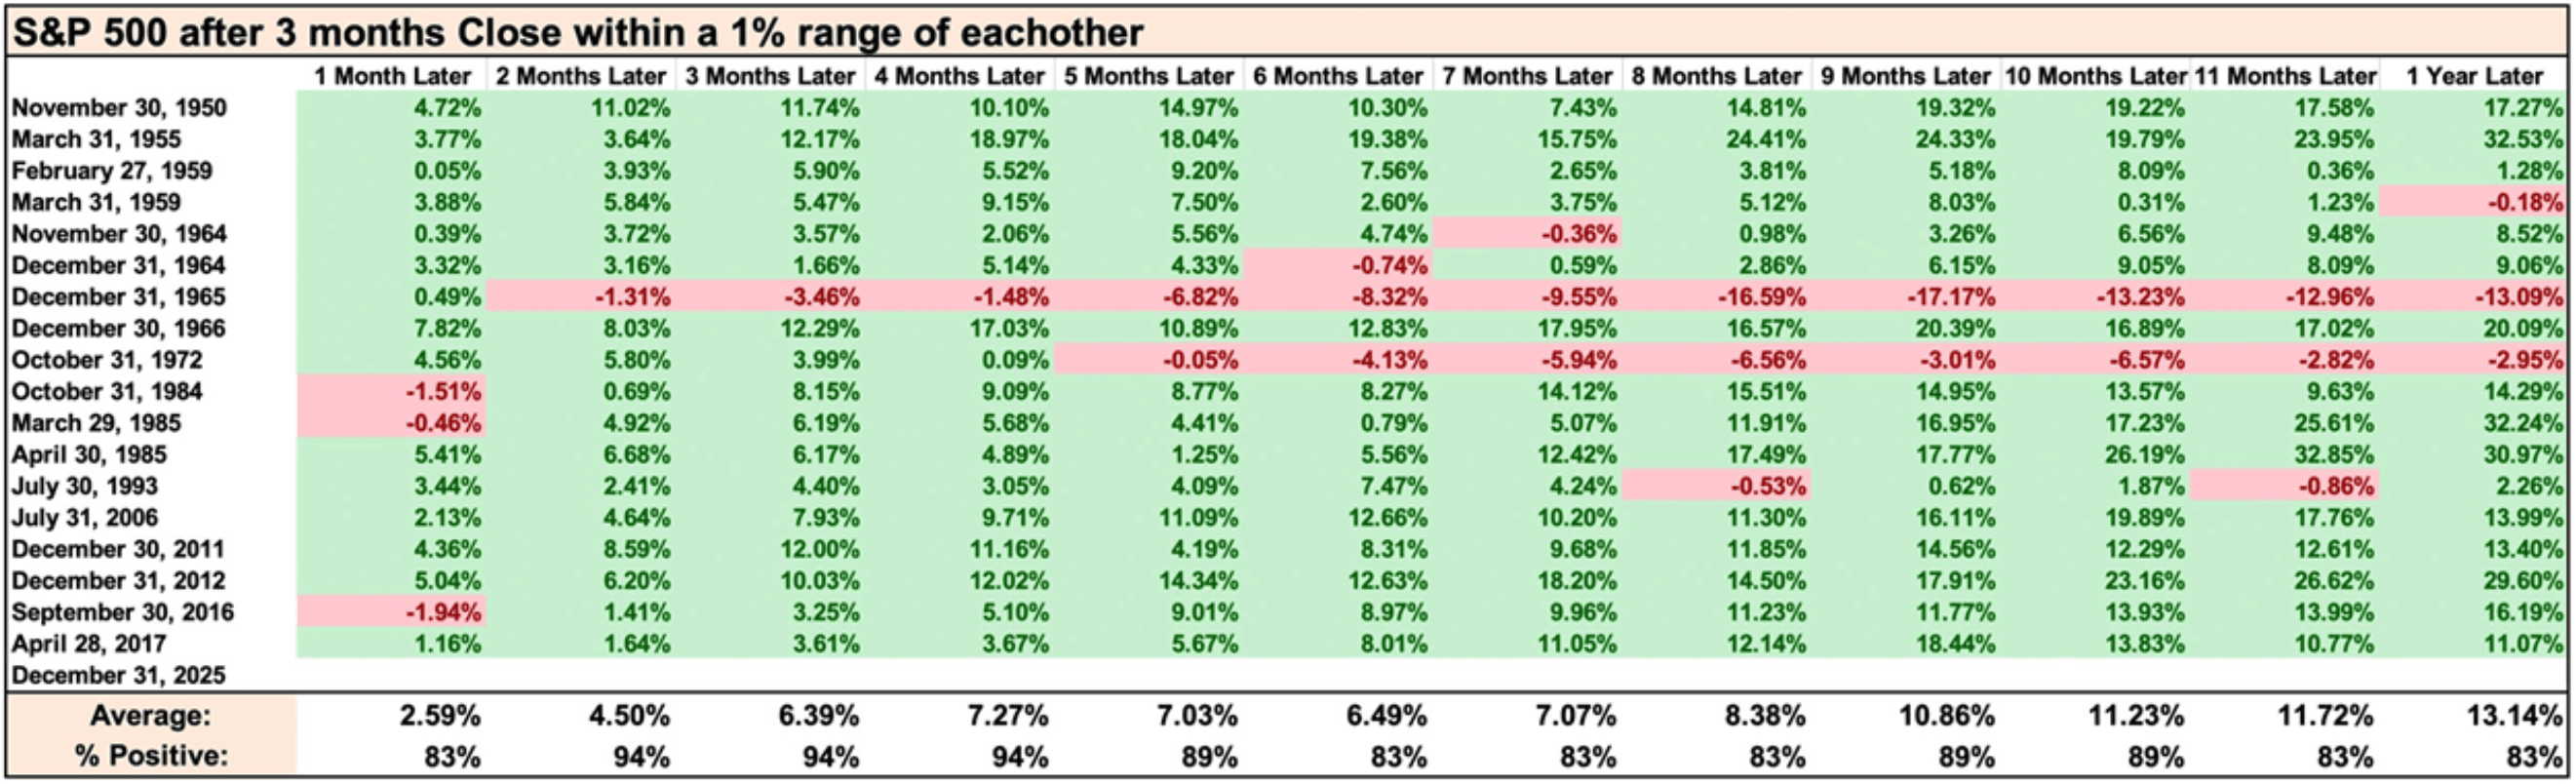
Combine this with the shallowing pattern I just showed you above…
And I like what I’m seeing in the markets right now.
Plus, remember that the shallowing/consolidation pattern you just saw was in the index…
Something that has very important implications for traders.
I explain below.
Insight of the Day
If the market is on the verge of breaking out, the leading stocks and sectors already are.
Remember, the market is just a broad aggregation of individual stocks.
If the market is about to break out…
Then it means that the leading stocks already are.
That’s what we want to be targeting right now.
If you recall, I showed you this in yesterday’s newsletter.
These are industries that are already breaking out…
And that’s where a lot of my focus is – and where yours should be – right now.
Of course, most traders have no clue what these leading sectors are…
And they miss out on these opportunities as a result.
So, if you want access to my proprietary TradingView indicators that can instantly show you all these leading sectors…
You can click here to grab this $5 deal.
Yes, you’ll get access to these proprietary sector strength indicators…
But that’s just the start of it.
Because you’ll also get one full year of access to LIVE weekly trading sessions with me and my team…
Where we’ll walk you through in REAL-TIME the opportunities we’re seeing in the market right now.
That’s 50+ live sessions for the price of a cup of coffee…
An absolutely “no lose” deal.
So click here to grab it and kick off 2026 on the right foot.
Customer Story of the Day
“By FAR !! the best way to understand the workings in the stock market. Ross and the team are the real deal, no BS.
I’m a lifetime full subscription member and couldn’t be more satisfied.”
")
Ross Givens
Editor, Stock Surge Daily
See more from Traders Agency on Google
Make us a preferred source and our market analysis will appear more prominently in your Google Search, Top Stories, and AI results.
Add to Preferred Sources