
Ross Givens
Chief Market Strategist
Ross Givens is a veteran trader with over 15 years of experience and a former VP at a major Wall Street investment bank. Specializing in small-cap stocks and momentum-driven plays, Ross identifies high-probability setups before they hit the mainstream. As Lead Strategist at Traders Agency, he has guided hundreds of successful trades and developed multiple flagship publications.
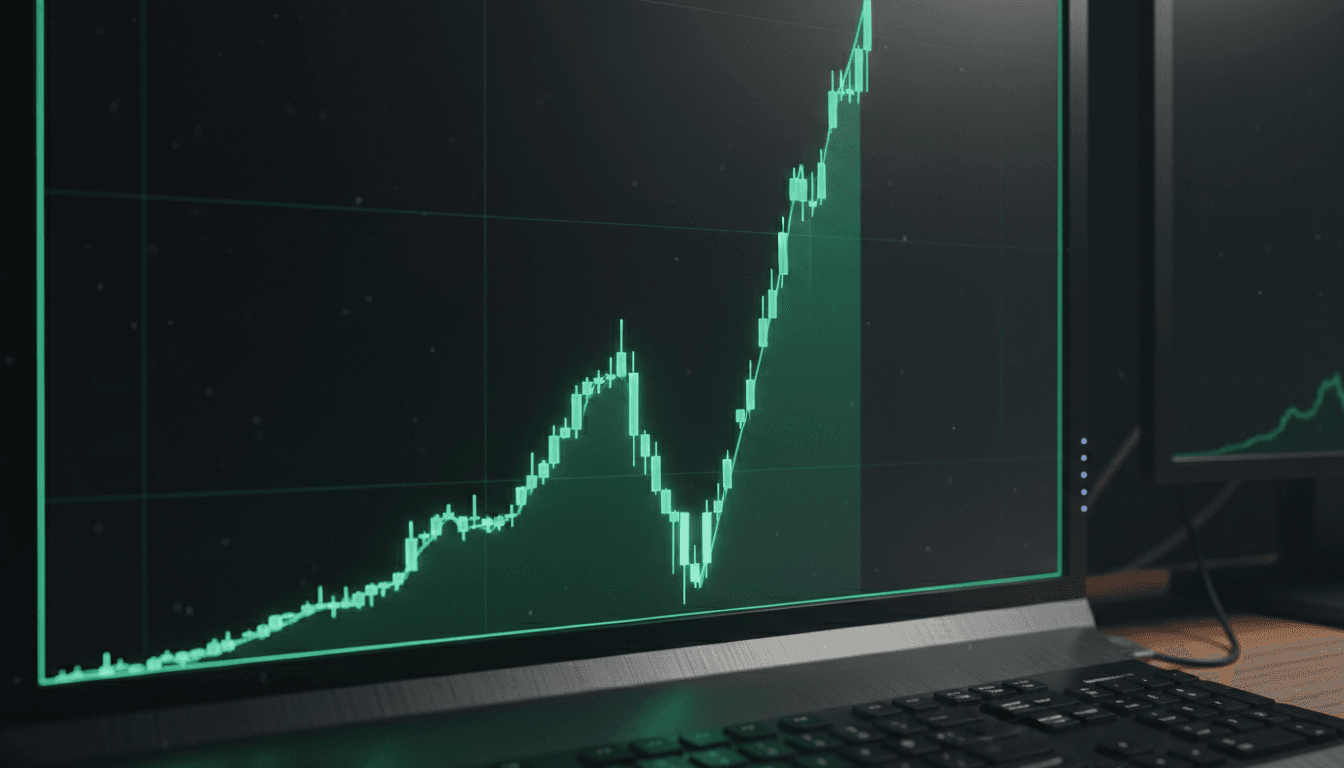
Are We in a Dip Buyer’s Paradise?
Hey, Ross here: As we close out the trading week, let’s look at an encouraging sign for the market. Chart of the Day Dip buyers are providing valuable support for the market – and articles like these (not to mention the recent market performance) – will only encourage more of them to join in. Even […]

A Cautious Strategy for Uncertain Markets (And Another Breakout)
Hey, Ross here: Here’s another actionable trading idea for you. Chart of the Day Allegro MicroSystems (ALGM) is the #1 semiconductor stock in the market. It ranks first among all 31 of its peers in both earnings and relative strength. The stock put in a shallow base from mid-February to this week with three progressively […]

How to REALLY Prepare for the Banking Crisis
Hey, Ross here: Here’s another actionable trading idea for you. Chart of the Day I bought shares of Intapp (INTA) last week. This company provides cloud-based services for the financial services industry. Business is booming. Sales grew by 25-30% in each of the last four quarters and the company is finally turning profitable. The stock […]

Don’t Trust This Beloved Market Signal? (Plus a Potential Breakout)
Hey, Ross here: Let’s get right into it with an actionable trading idea. Chart of the Day A nasty Stage 4 downtrend sent Spotify’s (SPOT) stock down by 80% over the last two years. But the stock is now trending higher. After reclaiming its 200-day moving average in January, SPOT has consolidated nicely in the […]

This “P-Word” Could Trigger a Huge Profits Wave
Hey, Ross here: As we start a new trading week, let’s look at a sign from the bond markets. Chart of the Day Stocks ended higher last week – but they really didn’t do much. The bond market, however, is a very different story. The interest rate on 2-year government bonds fell from 5.05% to […]
Are You Prepared for the Next Big Market Rally?
Hey, Ross here: Markets may have closed higher yesterday – but it was a very volatile session. In that vein, let’s make sure we stay prepared for any possible declines by looking at an actionable short trade idea. Chart of the Day America’s favorite drug dealer, Pfizer (PFE), has been steadily declining since the start […]

How “Flip-Flop” Traders Profit from the Market’s Decline
Hey, Ross here: With markets falling after the Fed’s rate hike yesterday, it’s time to look at a short trade idea instead. Chart of the Day Earlier this month, CareDX Inc. (CDNA) got absolutely crushed. The stock fell 32% in a single session after a Medicare policy change appeared to indicate it would no longer […]

These People Will Win from the Fed’s Decision
Hey, Ross here: With markets rising ahead of the Fed’s decision, let’s look at another long trade idea. Chart of the Day Internet-of-Things company Samsara (IOT) completely bucked the trend last month. It advanced beautifully and then gapped higher after reporting big sales growth in early March. The recent pullback has been minimal, and in […]

Pay Attention to THIS Instead of the Fed
Hey, Ross here: Markets closed higher yesterday, so here’s a long trade idea to start your day. Chart of the Day Palo Alto Networks (PANW) is a true honey badger. It does not seem to care whether the general market is going up or down. The stock jumped 40% to start the year and has […]

THIS is How You Profit in Today’s Diverging Market
Hey, Ross here: Welcome to a new trading week – and it’s a big one with the Fed meeting this week. To start, let’s review the divergent nature of the current markets. Chart of the Day In general, the major market indexes move together. The Dow, S&P and Nasdaq all move higher in a bull […]

A Future Market Leader in the Making? (Plus Understanding Fear/FOMO)
Hey, Ross here: As we end the trading week, here’s a stock that could be a future market leader. Chart of the Day ESAB Corporation (ESAB) is an industrial machinery producer with huge relative strength. The stock went public in 2022 – right in the middle of the bear market. It got crushed along with […]

While the Masses Panic, Here’s What the Elites are Really Doing
Hey, Ross here: We’ll talk a little more about the so-called “banking crisis” that’s plaguing the markets in a bit. But first, don’t forget that there are stocks that are always advancing no matter what’s happening in the markets. Chart of the Day Perion (PERI) is an Israeli-based digital advertising firm posting tremendous numbers. Sales […]
Stop watching.
Start winning.
50,000+ traders get our daily brief before the market opens.
You're subscribed!
Check your inbox.
Free. No spam. Unsubscribe anytime.
