
Ross Givens
Chief Market Strategist
Ross Givens is a veteran trader with over 15 years of experience and a former VP at a major Wall Street investment bank. Specializing in small-cap stocks and momentum-driven plays, Ross identifies high-probability setups before they hit the mainstream. As Lead Strategist at Traders Agency, he has guided hundreds of successful trades and developed multiple flagship publications.

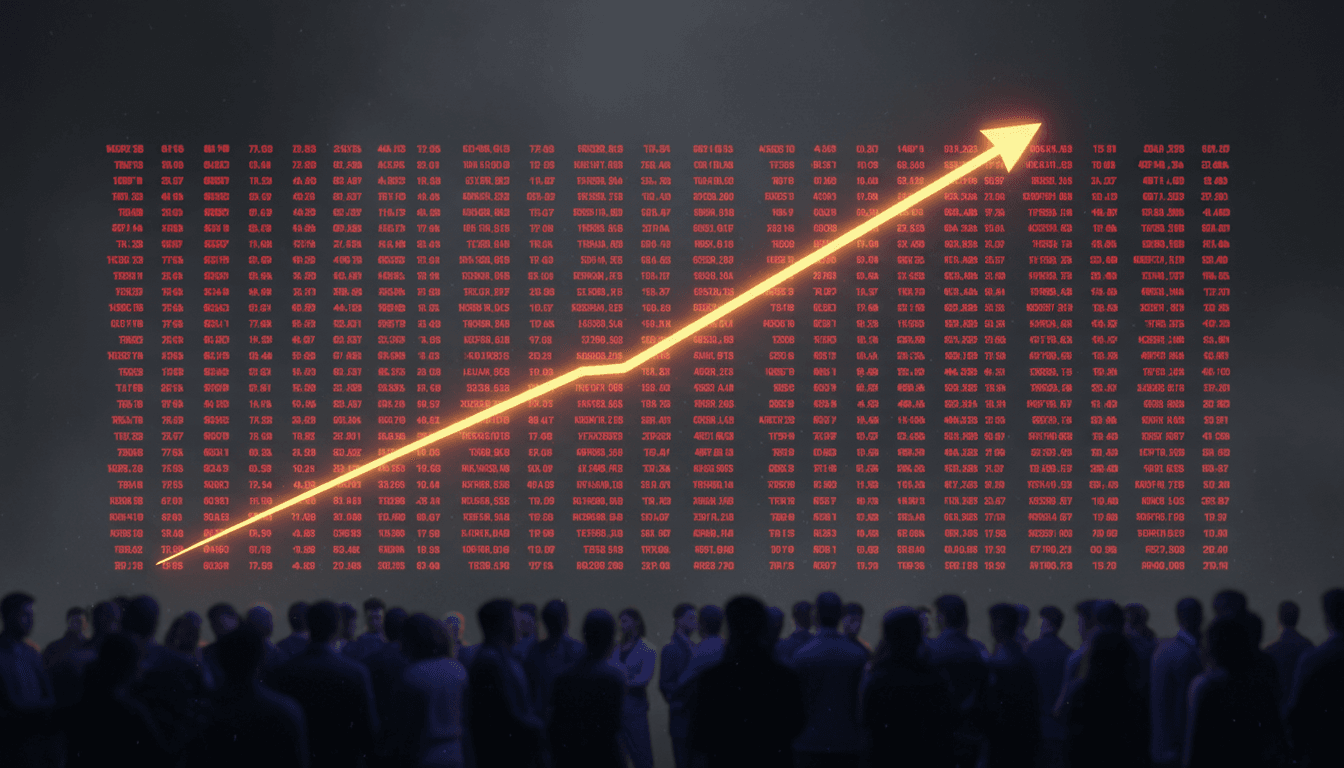
Stocks Moving Out of Correction Territory
Hey, Ross here: The S&P 500 is now about 6% down from recent highs. The Nasdaq is down about 9%. Both are now “officially” out of correction territory. There’s...

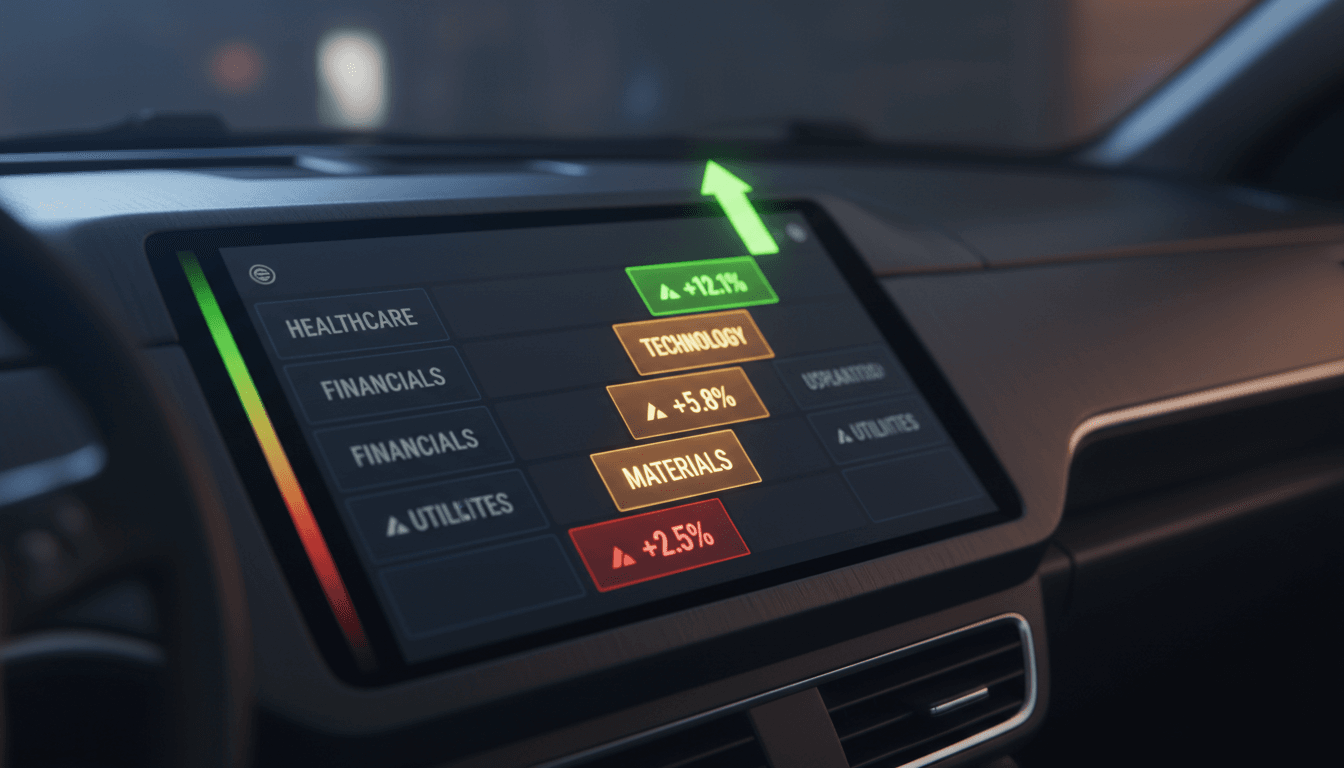
Should You Target These Sectors?
Hey, Ross here: The S&P 500 just reclaimed its 200-day moving average. It first fell below this level two weeks ago. We’ll still need to see more follow...

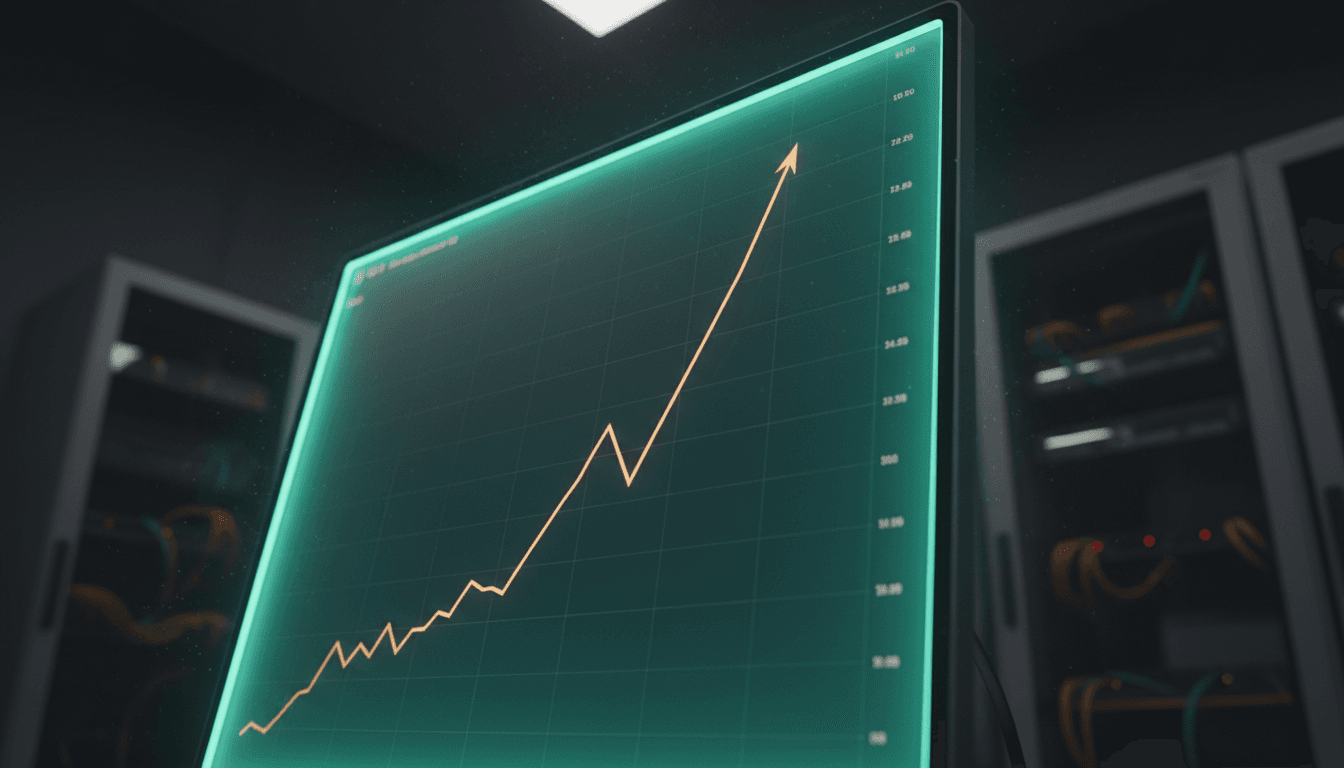
A “Narrow Recovery” in the Cards?
Hey, Ross here: Welcome back to a new trading week. The major indexes all managed to close slightly higher last week. But as today’s chart shows – I’m not...

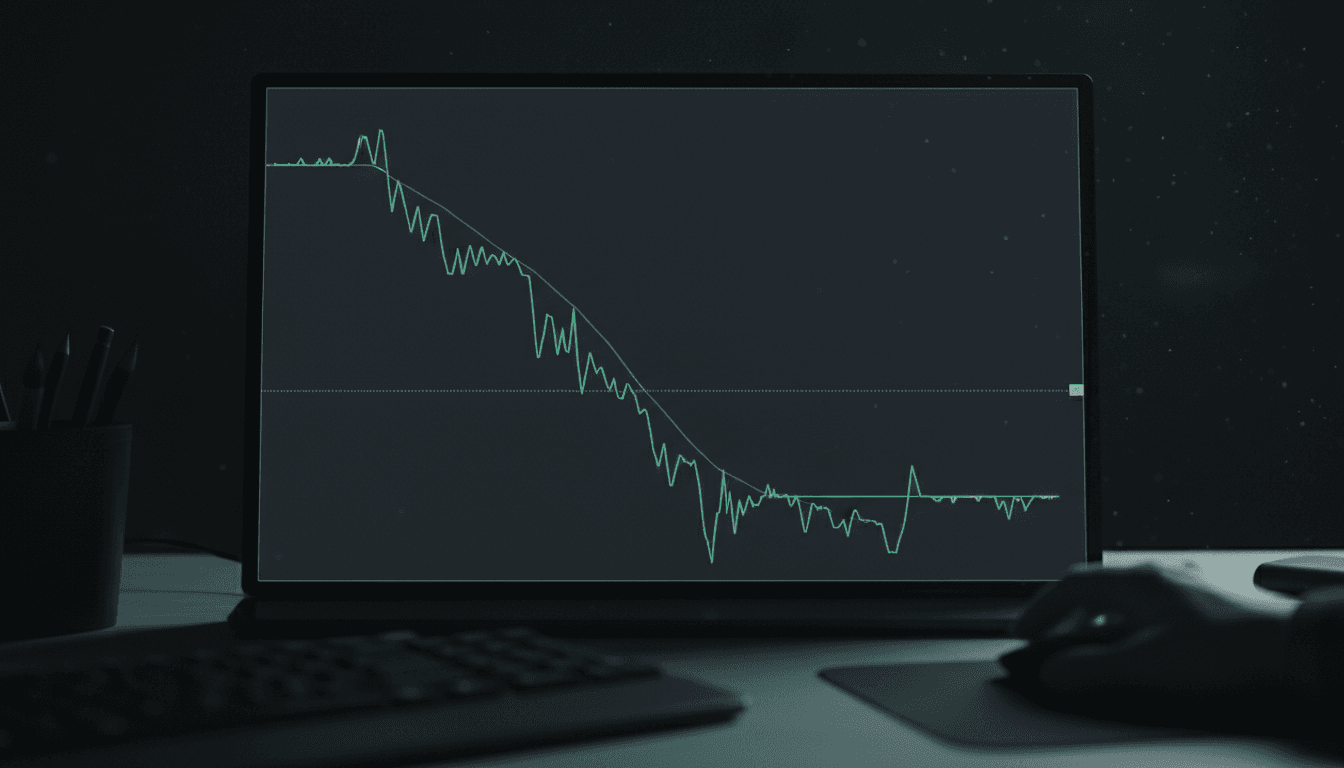
Who’s Buying the Dip? (Pay Attention)
Hey, Ross here: Who’s buying the market dip? The chart below tells us. Chart of the Day This chart shows the ratio of buying to selling by the corporate...

Fed Day Breadth Surge
Hey, Ross here: As expected, the Fed held rates steady yesterday. And while Powell cited lower growth and tariff uncertainty (which he said could cause...
When Uncertainty Peaks
Hey, Ross here: The Fed announces its latest rate cut decision later this afternoon. They will almost certainly hold rates steady. But Fed Chair Powell’s press...
This Market Catalyst is Still There
Hey, Ross here: Throughout the current bull market, there has been one catalyst that was likely responsible for a significant portion of its gains. Today’s...
Follow Through Required
Hey, Ross here: Last week was another down week for the markets… And yet Friday saw the indexes post their best day since November 2024. My take? We’re going...

Impending Recession?
Hey, Ross here: As markets sold off, the “R-word” – recession – has come back in force. But as today’s chart shows, just like all the times recession fears...

Zoom Out and Look at This
Hey, Ross here: Thanks to the sharp pullback, we have so many traders screaming about how this is the “end of the bull market”. But if we step back and put...
The Truth About This “Market Panic”
Hey, Ross here: The S&P 500 has fallen below its 200-day moving average. And only 35% of stocks are now above their own 200-day moving averages. But as today’s...

Gear Up for This Market Event
Hey, Ross here: I mentioned yesterday that the market is likely oversold. Today, let’s look at a chart that shows why that may be the case. Chart of the Day...
Stop watching.
Start winning.
50,000+ traders get our daily brief before the market opens.
You're subscribed!
Check your inbox.
Free. No spam. Unsubscribe anytime.
