Stock Market Blog
Daily stock market analysis, trade alerts, and trading education from Ross Givens and the Traders Agency team.

Are You In a Crowded Trade?
The SpaceX IPO is going LIVE today. What’s going to happen next – and does the massive hype mark the “top” for the market? Find out inside.
One Pullback After Another
The SpaceX IPO is going LIVE today. What’s going to happen next – and does the massive hype mark the “top” for the market? Find out inside.

SpaceX Canceled the Pullback?
The SpaceX IPO is going LIVE today. What’s going to happen next – and does the massive hype mark the “top” for the market? Find out inside.

Does the SpaceX IPO Mark the “Top” for Tech?
The SpaceX IPO is going LIVE today. What’s going to happen next – and does the massive hype mark the “top” for the market? Find out inside.

Could the SpaceX IPO End the Pullback?
The pullback continues. But the question on people’s minds is – could the SpaceX IPO end the pullback? Ross investigates.

Could This Tech Selloff Spread to the Rest of the Market?
The tech selloff continues. Could it lead to a broader market selloff? Ross explores the situation inside.
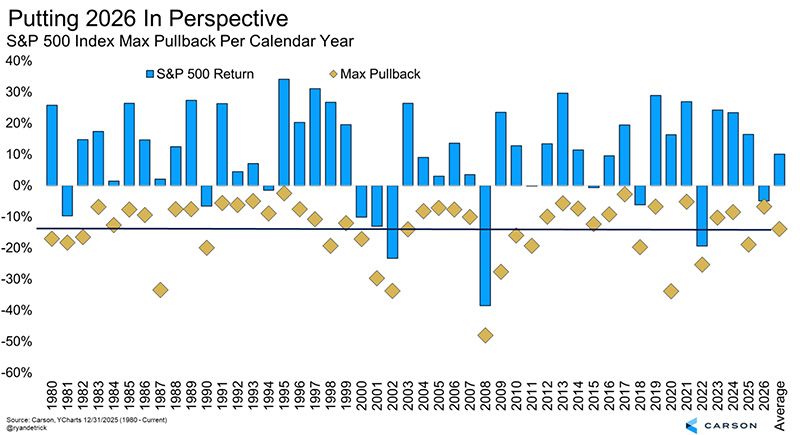
Pullback Perspective (Must Read)
Worried about the pullback? Then you need to read this as Ross’ provides valuable perspective on the whole thing.
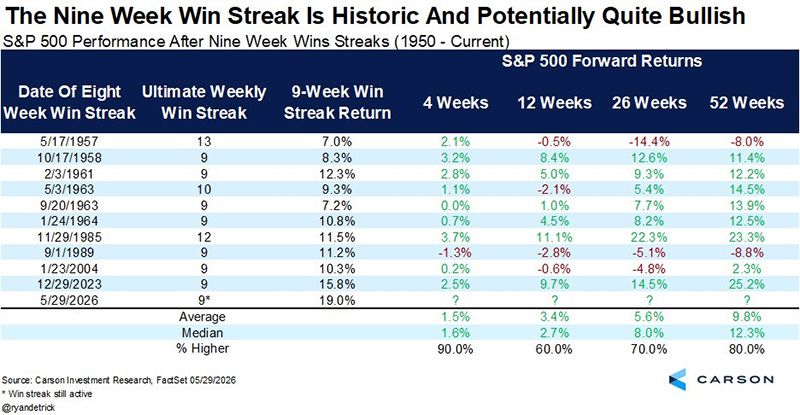
Reasons Behind the Market Plunge
Last Friday delivered the worst day of 2026 for both the Nasdaq and S&P 500 — and the “good” jobs report may be a big reason why. Payrolls came in hotter than expected, rate-hike odds jumped, and the market finally snapped after a 9-week win streak. I’ll show you why this pullback may be healthy, why it doesn’t feel that way in real time, and how I’m preparing for the next wave of breakout opportunities.
Blood in the Water
Have you heard of the phrase “chumming the water”? Because that’s what’s happening in the market now – and the sharks are circling.

A Broad-Based Breakout
The skeptics have come out to say that this rally is too fragile… that it can’t possibly last. Ross sets the record straight.
The Most Hated Rally Ever?
Buyers are clearly in control. But the next pause may be the moment smart traders should pay closest attention.

Proof the Smart Money is Always One Step Ahead
The market bottomed when it did for a reason. And one group of investors was already moving before everyone else noticed.
Stop watching.
Start winning.
50,000+ traders get our daily brief before the market opens.
You're subscribed!
Check your inbox.
Free. No spam. Unsubscribe anytime.
