
Hey, Ross here:
The 10-year Treasury yield has been ripping higher.
People are asking – how much can stocks take?
And that’s a fair question…
Because rising yields can hurt the market.
But the answer isn’t as simple as “yields up, stocks down.”
Take a look.
Chart of the Day
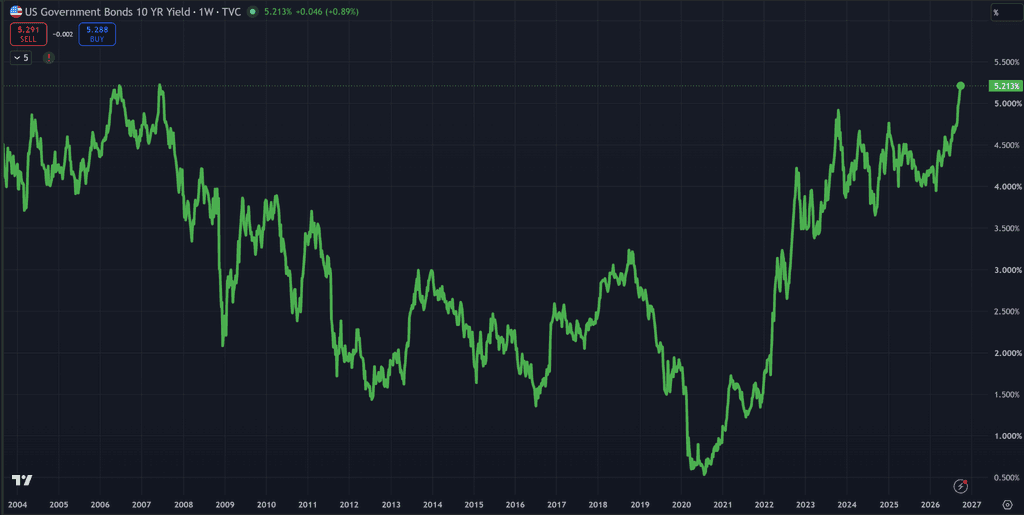
The 10-year yield has surged to a new 20-year high.
It’s now sitting roughly 19% above its 200-day moving average.
That’s a monster move.
And higher yields create a very simple problem for stocks:
Investors suddenly have a much better alternative.
Why take a bunch of risk in stocks when Treasuries are paying you more?
That tends to put pressure on valuations.
We saw exactly that in 2022.
Yields ripped higher.
P/E multiples got crushed.
Stocks followed.
Now look at this:
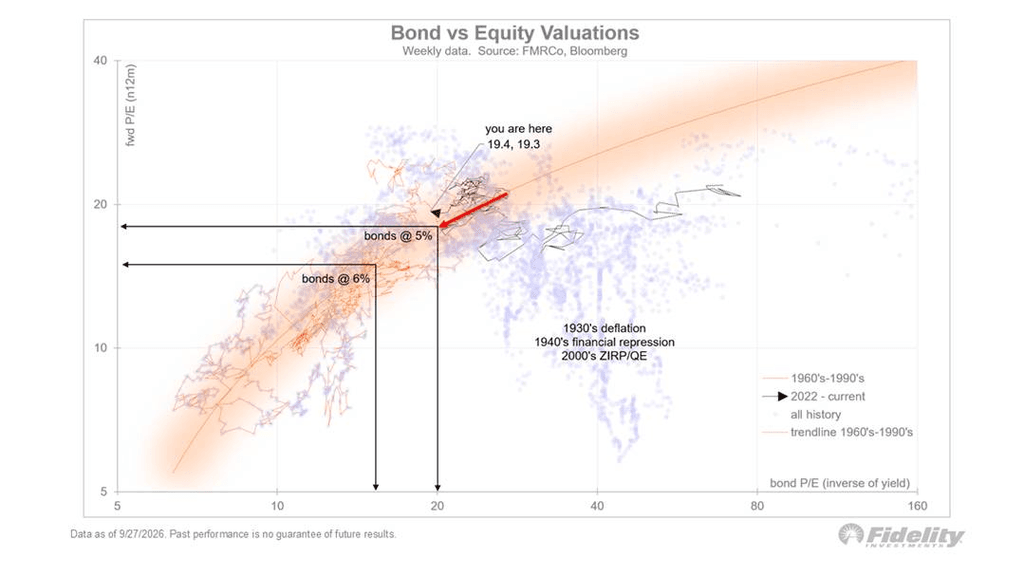
This gives us a rough idea of how much pressure higher yields could put on valuations.
If the 10-year eventually reaches 6%, this model suggests the market could support something closer to a 16X P/E.
Right now, it’s roughly 19–20X.
So you’re talking about potentially a 20% haircut to the multiple.
That sounds ugly.
But here’s the other side of the equation.
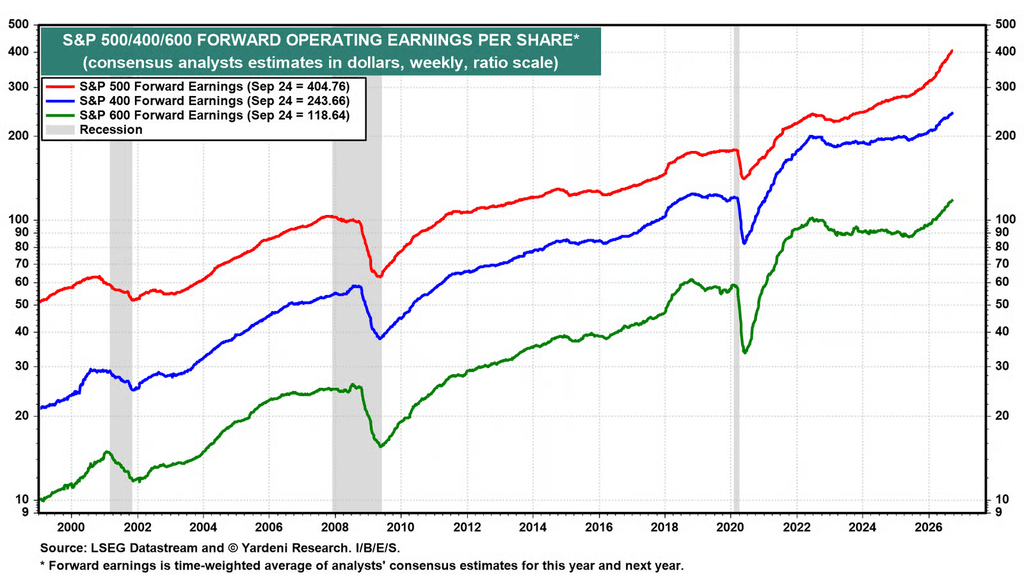
Forward earnings estimates are still climbing.
And not just for the S&P 500.
The uptrends are still intact across the S&P 500, S&P 400 and S&P 600.
That’s a big deal.
Because if investors pay less for every dollar of earnings…
But companies are producing more earnings at the same time…
A lot of that valuation hit can get absorbed by the earnings growth.
That’s why I don’t think you can simply look at 2022 and assume the same thing is about to happen.
Back then, multiples were collapsing while earnings growth was much weaker.
Today, earnings estimates are still moving higher.
But I’m not completely relaxed about this either.
Because look underneath the index:
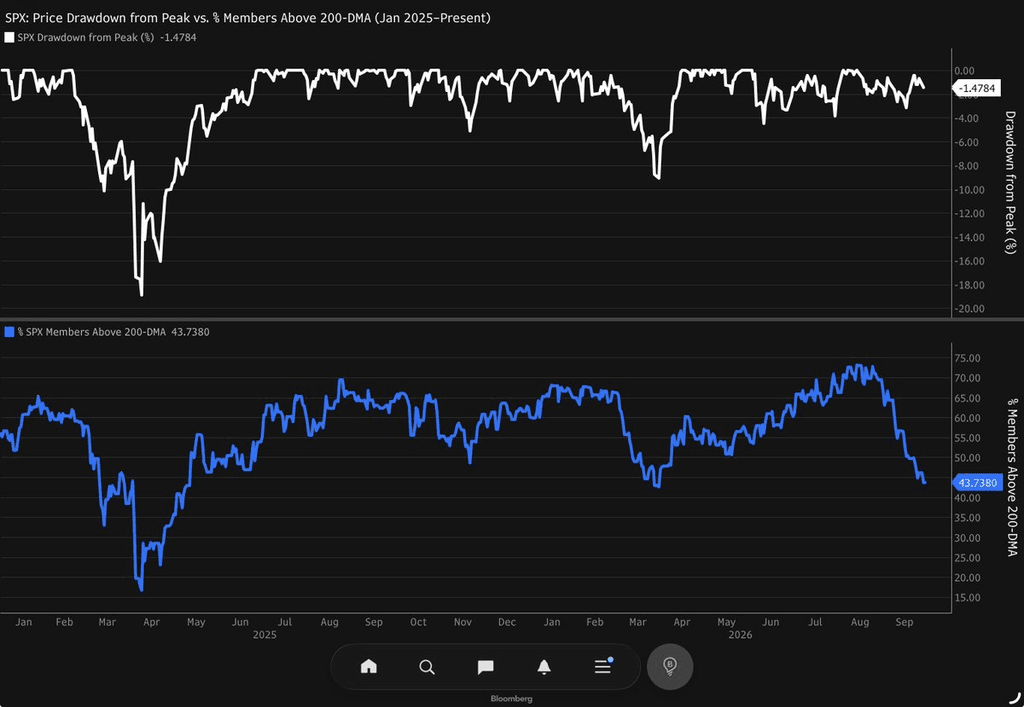
The S&P 500 is still less than 2% below its peak.
But fewer than 44% of its stocks are above their 200-day moving averages.
The last time breadth was this weak, the index itself was down roughly 12%.
This time?
The S&P barely looks damaged.
The average stock does.
And that’s where I’m paying attention.
Insight of the Day
Don’t watch yields alone – watch what breaks first.
Everybody can see the 10-year going up.
That part is easy.
The harder question is what those higher yields actually start breaking.
Do forward earnings estimates roll over?
Do the strongest stocks stop leading?
Do breakouts start failing?
Does breadth keep getting worse?
That tells me a lot more than whether the 10-year is at 5.2%, 5.5% or 6%.
Right now, the picture is mixed.
Earnings estimates are still climbing.
The major indexes are still holding up.
But underneath them, breadth has already taken a pretty nasty hit.
So that’s the pressure point I’m watching first.
If yields stay high and breadth keeps deteriorating…
Then I’d start getting much more concerned that the weakness is spreading toward the big stocks still holding the indexes up.
But if breadth starts improving while earnings keep climbing?
Then this market may be able to handle much higher yields than a lot of people expect.
That’s why I’m not making some giant bearish call just because the 10-year is ripping higher.
I want to see what actually breaks.
And right now, there are still individual stocks showing plenty of strength.
In fact, I just spotted two breakout trades that caught my eye.
Customer Story of the Day
“I am extremely pleased with the service I have received as normal.
I have never been disappointed ever. The way it looks no one has or ever will.
There is a good group of people here ready to help no matter the issue.
Thank you guys. Will talk again soon.”

Ross Givens
Editor, Stock Surge Daily
See more from Traders Agency on Google
Make us a preferred source and our market analysis will appear more prominently in your Google Search, Top Stories, and AI results.
Add to Preferred Sources