Hey friend,
Nothing on the economic calendar today.
Wednesday though, we get the latest inflation data.
And with so many already criticizing Fed Chair Warsh for seemingly “doing nothing” about inflation…
It could be a big market mover.
The Daily Direction
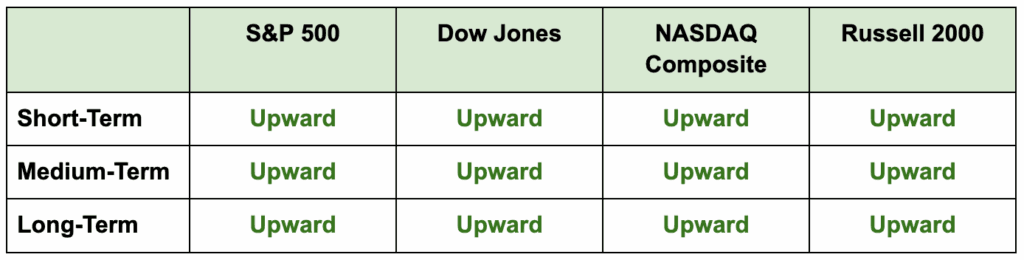
Note: All indexes closed higher to end last week and have been moving higher this morning as well. All index directions remain in the green.
The Daily Nugget
Normal is useful.
Traders spend a lot of time looking for things that stand out.
Big moves.
Heavy volume.
A sudden breakout.
But before you can tell whether something is unusual, you need to know what that stock normally does.
A million shares traded in a day might look like a lot.
For Apple, it’s nothing.
For some sleepy small-cap stock that usually trades 80,000 shares?
Now you may have something worth checking.
The same goes for price action.
A 4% move in a volatile biotech stock might be business as usual.
A 4% move in a stock that barely moves 1% most days deserves a second look.
That’s why a stock’s own history can be more useful than comparing it with everything else in the market.
You’re looking for a break in character.
Something that normally stays quiet suddenly gets busy.
Something that usually follows the market suddenly stops.
Something changes.
And that’s a very powerful clue.
The key is not to jump straight to a conclusion.
Start by asking what changed compared with the stock’s own normal behavior.
Then look for confirmation elsewhere.
Price.
Volume.
News.
Sector action.
Anything that helps explain whether the change is real or just noise.
You don’t need to predict the whole move.
You just need to recognize when a stock is no longer behaving the way it usually does.
That alone can tell you where to look next.

The Traders Agency Team
See more from Traders Agency on Google
Make us a preferred source and our market analysis will appear more prominently in your Google Search, Top Stories, and AI results.
Add to Preferred Sources