
The Fed finally pulled the trigger yesterday.
Rates are now higher.
And judging by the latest projections, they probably aren’t done yet.
But if you’re trying to figure out what that means for stocks…
There’s one part of the story I’d pay much more attention to than the hike itself.
Chart of the Day
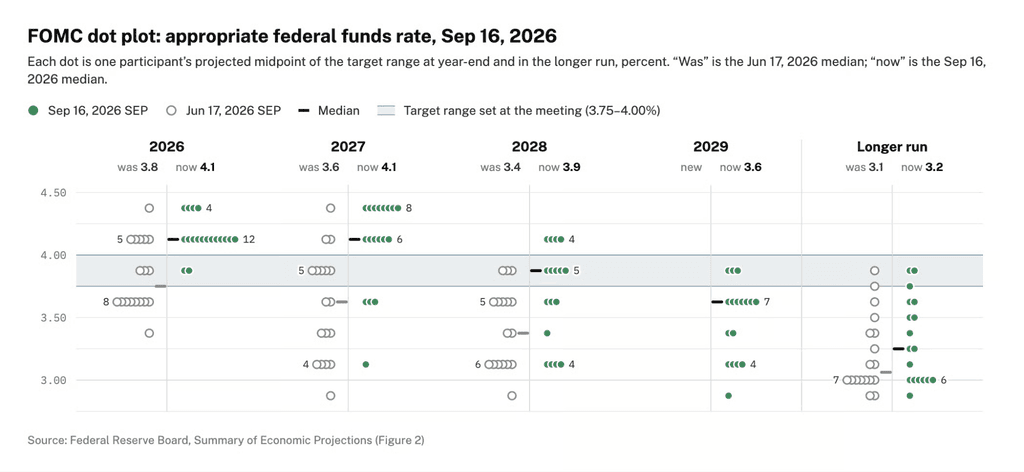
The Fed raised its target range by 25 basis points to 3.75%–4.00%.
And the new dot plot points to one more hike before year-end.
After that, the median forecast has rates basically holding steady through 2027.
So for now, the Fed isn’t signaling some endless march higher.
And that’s good news…
Because history says that, when it comes to the effect of rate hikes on stock returns…
The real question isn’t simply whether rates go up.
It’s how quickly they go up.
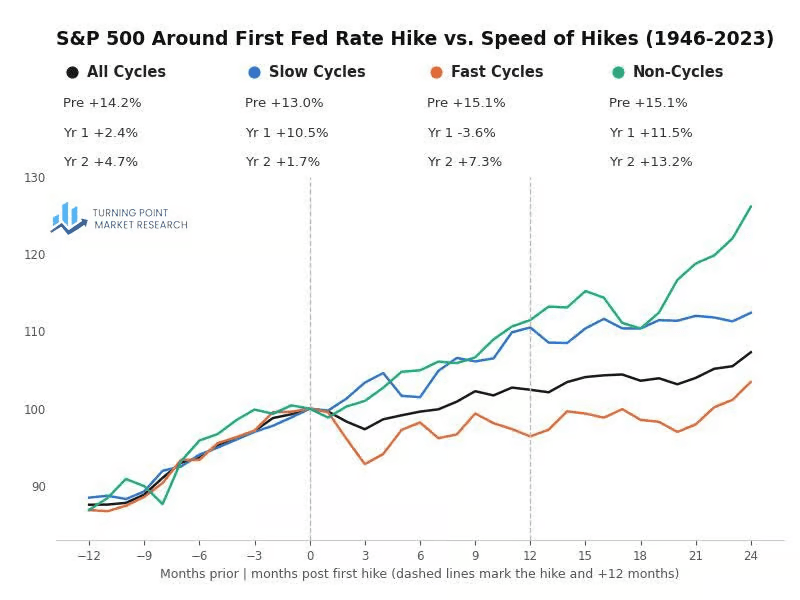
This chart compares the S&P 500 after the first hike in slow tightening cycles versus fast ones.
The difference is huge.
During slow hiking cycles, the S&P 500 gained an average 10.5% over the following year.
During fast cycles?
It lost 3.6%.
Same basic direction in policy…
Completely different results for stocks.
A few measured moves is one thing.
A string of aggressive hikes is another.
So far, the Fed is pointing to a relatively slow tightening cycle.
But rates are still heading higher, stocks have already been struggling, and history says things get ugly fast if the Fed has to accelerate from here.
This is not the kind of backdrop where I want to buy the average stock and hope the market bails me out.
If I’m putting money to work here, I want a stock giving me a damn good reason.
And preferably, I want it doing something completely abnormal.
Insight of the Day
In a tougher market, it’s good to be weird.
Most stocks are pretty boring.
They move with the market.
They follow their sector.
They sell off when everything else sells off.
That’s not what I’m hunting for right now.
I want the stock that suddenly starts behaving in a way that doesn’t fit.
Maybe the market is getting hammered and it barely budges.
Maybe a sleepy stock suddenly wakes up.
Maybe something starts happening underneath the surface before the price itself really gets moving.
That’s when I start digging.
Because in a market where the usual tailwinds aren’t doing much for you, a stock acting completely out of character can be a much bigger clue.
And I have one “underground” signal designed specifically to find those situations.
It can flag activity most traders never even think to look for…
Sometimes before there’s any clear explanation for why it’s happening.
I’ll tell you more about this tomorrow morning…
So make sure you keep an eye out for that in your inbox.
But for today…
Did you know that Intel’s former CEO just bought one tiny $3 stock (and I’m going in)?
Customer Story of the Day
“I am extremely pleased with the service I have received as normal.
I have never been disappointed ever. The way it looks no one has or ever will.
There is a good group of people here ready to help no matter the issue.
Thank you guys. Will talk again soon.”
Ross Givens
Editor, Stock Surge Daily
See more from Traders Agency on Google
Make us a preferred source and our market analysis will appear more prominently in your Google Search, Top Stories, and AI results.
Add to Preferred Sources