Skip to content
BLOG

Stock Market Blog

Daily stock market analysis, trade alerts, and trading education from Ross Givens and the Traders Agency team.
Showing 1056–1067 of 3759 articles
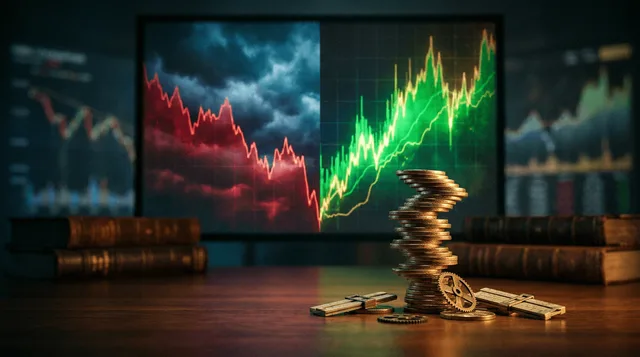
A dramatic split-screen visualization of a financial market chart showing a sharp volatility spike, with one side depicting a steep red plunge and the other a violent green surge, symbolizing the dual-directional nature of market turbulence. In the foreground, a teetering stack of gold coins or a precarious Jenga tower built from financial instruments represents the record leverage and borrowed money amplifying every market move. The overall color palette shifts from an ominous deep red and stor
Stock Surge Daily
Stock Surge Daily

Q3 Volatility Spike Incoming?

The hottest trade in the market may be changing character. And when momentum starts to crack, late buyers can get trapped fast.


Ross Givens
Ross Givens
Jun 29, 2026
A chameleon perched on a stock market trading terminal or monitor, its skin displaying shifting colors that mirror the greens and reds of options charts and financial data visualizations.
Deep Dive
Deep Dive

Market Chameleon Review

Market Chameleon review: is it worth it for options traders? We break down implied volatility tools, earnings analytics, and pricing so you can decide.

TAT
Traders Agency Team
Jun 29, 2026
A split-screen composition showing two contrasting newspaper front pages or phone screens — one blaring red with alarming financial headlines and one gleaming green with euphoric bull market news — facing each other in dramatic tension. In the center foreground, a single calm, focused trader sits with arms crossed, unmoved by the chaos on either side, symbolizing disciplined detachment. The overall mood should feel cinematic and high-contrast, with the trader bathed in neutral light while the su
Traders Daily Direction

2 Types of Dangerous Market Headlines

There is a powerful trading edge that 99% of traders will never be able to achieve. And the kicker is – it has nothing to do with market knowledge.

TAT
Traders Agency Team
Jun 26, 2026
A massive black oil supertanker cuts through deep blue ocean waters, shot from a dramatic low angle that emphasizes its enormous scale against a stormy, golden-lit sky.
Stock Analysis
Stock Analysis

Forget Oil... These 3 Shipping Stocks Are PRINTING Money

Oil tanker stocks are quietly minting cash as VLCC day rates hit $470K/day — triple last month's levels. Here's why falling oil prices mean rising tanker p

Ross Givens
Ross Givens
Jun 26, 2026
A dramatic aerial view of a speeding train approaching a fork in the tracks, with one path leading into a dark tunnel and the other branching off into open, sunlit terrain. The image captures the critical moment of decision — staying on a fading momentum trade versus jumping to a new opportunity. The contrast between shadow and light visually reinforces the article's core message about recognizing a market top and knowing when to pivot.
Stock Surge Daily
Stock Surge Daily

Is the Semiconductor Trade Over? (What to do Instead)

The hottest trade in the market may be changing character. And when momentum starts to crack, late buyers can get trapped fast.

Ross Givens
Ross Givens
Jun 26, 2026
A chess board viewed from above, with stock market candlestick charts reflected in the glossy surface of the pieces, symbolizing the strategic game of information in financial markets. One chess piece — a king — stands illuminated under a dramatic spotlight, casting long shadows across the board, representing the power of superior knowledge. The background subtly blends into a dark, moody financial trading floor aesthetic, reinforcing the high-stakes nature of market intelligence.
Traders Daily Direction

The Game Beneath the Market

There is a powerful trading edge that 99% of traders will never be able to achieve. And the kicker is – it has nothing to do with market knowledge.

TAT
Traders Agency Team
Jun 25, 2026
A close-up of healthy versus damaged kidney tissue split down the middle, with one side showing vibrant, intact cells and the other showing deteriorating, protein-clouded tissue under a dramatic, high-contrast medical visualization style.
Stock Analysis
Stock Analysis

The FDA Decides July 7... Wall Street Thinks This $35 Stock Doubles

Vera Therapeutics stock faces an FDA decision July 7. Phase 3 crushed expectations with 46% kidney protein reduction. Wall Street targets $83.50 on this $3

Ross Givens
Ross Givens
Jun 25, 2026
A dramatic split-scene image showing the Federal Reserve building on one side and a stock market chart on the other, with a visual tension between them — perhaps connected by a tug-of-war rope or a bold lightning bolt. The stock chart should show a peak (representing "market top") with an ambiguous trajectory, neither clearly crashing nor soaring, reinforcing the article's theme of uncertain conventional wisdom. The overall mood should feel urgent and thought-provoking, using deep blues and shar
Stock Surge Daily
Stock Surge Daily

Will the Fed Crush the Stock Market?

The SpaceX IPO is going LIVE today. What’s going to happen next – and does the massive hype mark the “top” for the market? Find out inside.

Ross Givens
Ross Givens
Jun 25, 2026
A split composition showing a crowd of people all rushing in one direction toward glowing logos of mega-cap tech giants, while a single contrarian figure calmly walks the opposite way toward a small, bright rising stock chart. The lone figure is lit with warm, golden light suggesting opportunity and clarity, while the crowd is cast in a cooler, bluish hue representing herd mentality. The visual contrast between mass movement and independent thinking immediately communicates the theme of learning
Traders Daily Direction

The Type of Trading Mistakes You Should Love

There is a powerful trading edge that 99% of traders will never be able to achieve. And the kicker is – it has nothing to do with market knowledge.

TAT
Traders Agency Team
Jun 24, 2026
A dramatic split image showing a glowing quantum computer chip suspended in an icy, deep-space blue environment, surrounded by swirling frost and cryogenic vapor to represent the extreme cold required for quantum computing.
Stock Analysis
Stock Analysis

The Government Just Bet $2 Billion On Quantum... These 2 Stocks Are Next

Government quantum computing investment just hit $2B across 9 private firms. These 2 picks-and-shovels stocks sit in the direct path of that funding.

Ross Givens
Ross Givens
Jun 24, 2026
A split-screen composition showing a trader's hands hovering over a glowing touchscreen interface displaying colorful visual flowchart nodes and decision trees, representing the no-code bot builder.
Deep Dive
Deep Dive

OptionAlpha Review

Option Alpha review: no-code bot builder, unlimited backtesting, and automated options trading for retail traders. See who it's built for and what it deliv

TAT
Traders Agency Team
Jun 24, 2026
A dramatic split-screen visual showing a towering skyscraper (representing Big Tech) with visible cracks forming in its glass facade, while in the foreground, a cluster of smaller, brightly lit buildings stand strong and upward-trending. The contrast between the crumbling giant and the resilient smaller structures immediately conveys the market rotation story. Bold, dynamic lighting — perhaps a stormy sky behind the large building and a break of sunlight illuminating the smaller ones — reinforce
Stock Surge Daily
Stock Surge Daily

Big Tech Breaking Down?

The SpaceX IPO is going LIVE today. What’s going to happen next – and does the massive hype mark the “top” for the market? Find out inside.

Ross Givens
Ross Givens
Jun 24, 2026
Join the Edge

Stop watching.
Start winning.

50,000+ traders get our daily brief before the market opens.

Free. No spam. Unsubscribe anytime.

Traders AgencyWhat Customers Say
4.8
1,544
