

Hey, Ross here:
When you hear that a sector is doing well, it’s tempting to assume most of its stocks are good places to be.
But as today’s chart shows…
This isn’t necessarily the case.
Chart of the Day
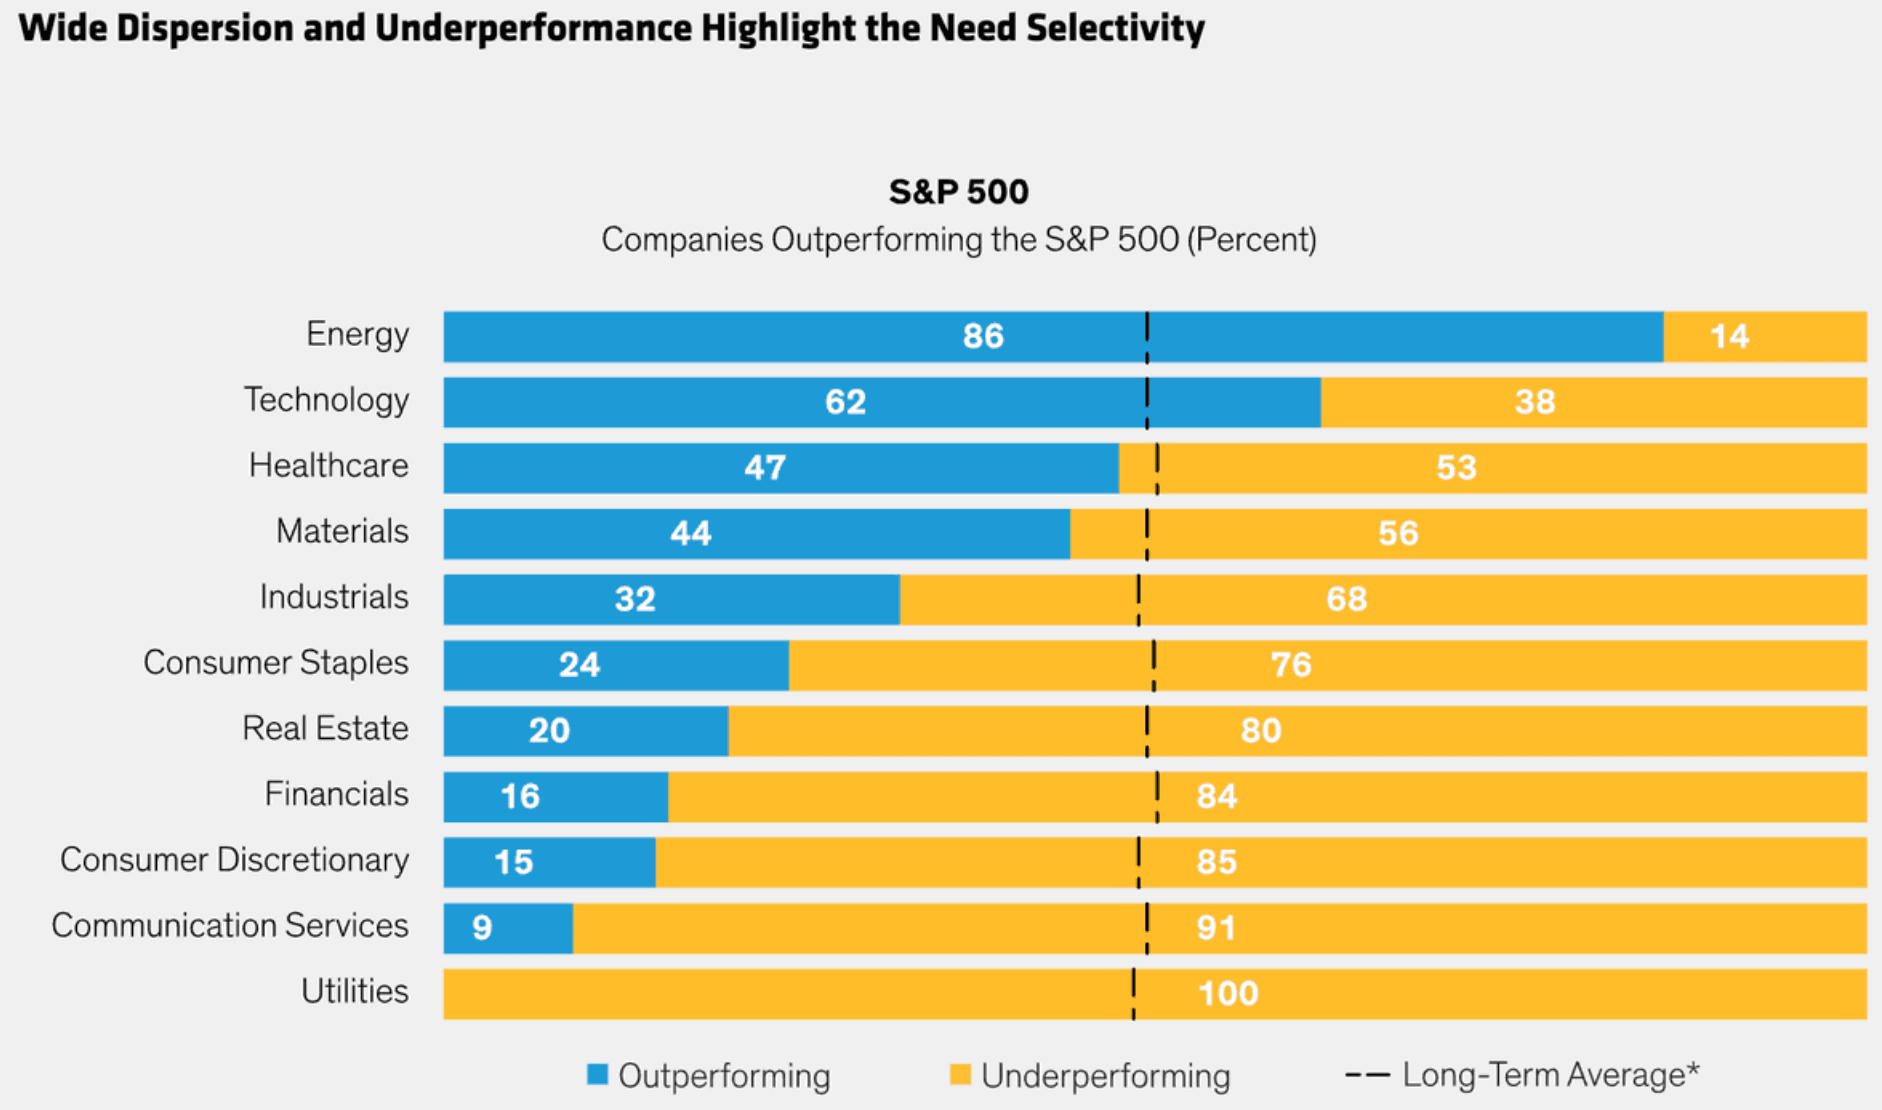
The blue part of each bar shows the percentage of stocks in that sector beating the S&P 500 this year.
The yellow part shows the percentage lagging it.
So the numbers tell us how many stocks are ahead – not how much those stocks have gained.
Now look at healthcare.
We recently looked at its sector breakout.
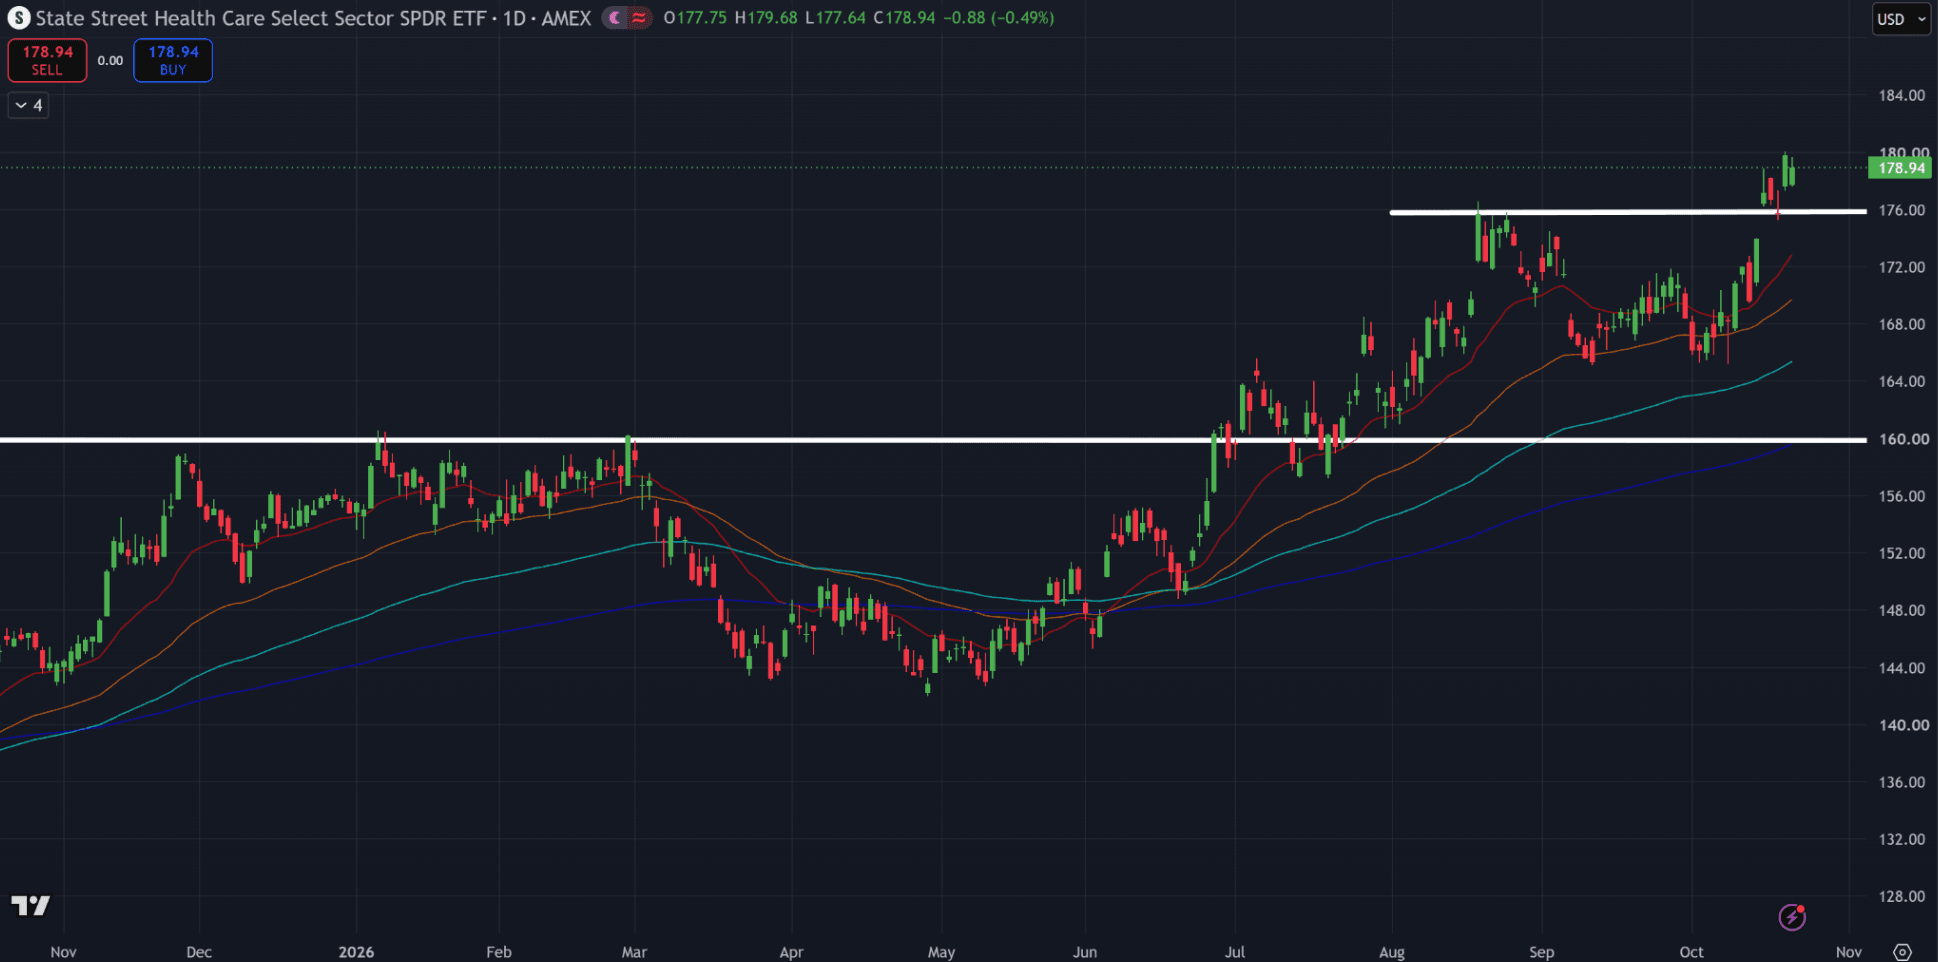
Yet 53% of its stocks were still trailing the S&P 500 year to date in this snapshot.
Consumer staples make the contrast even sharper.
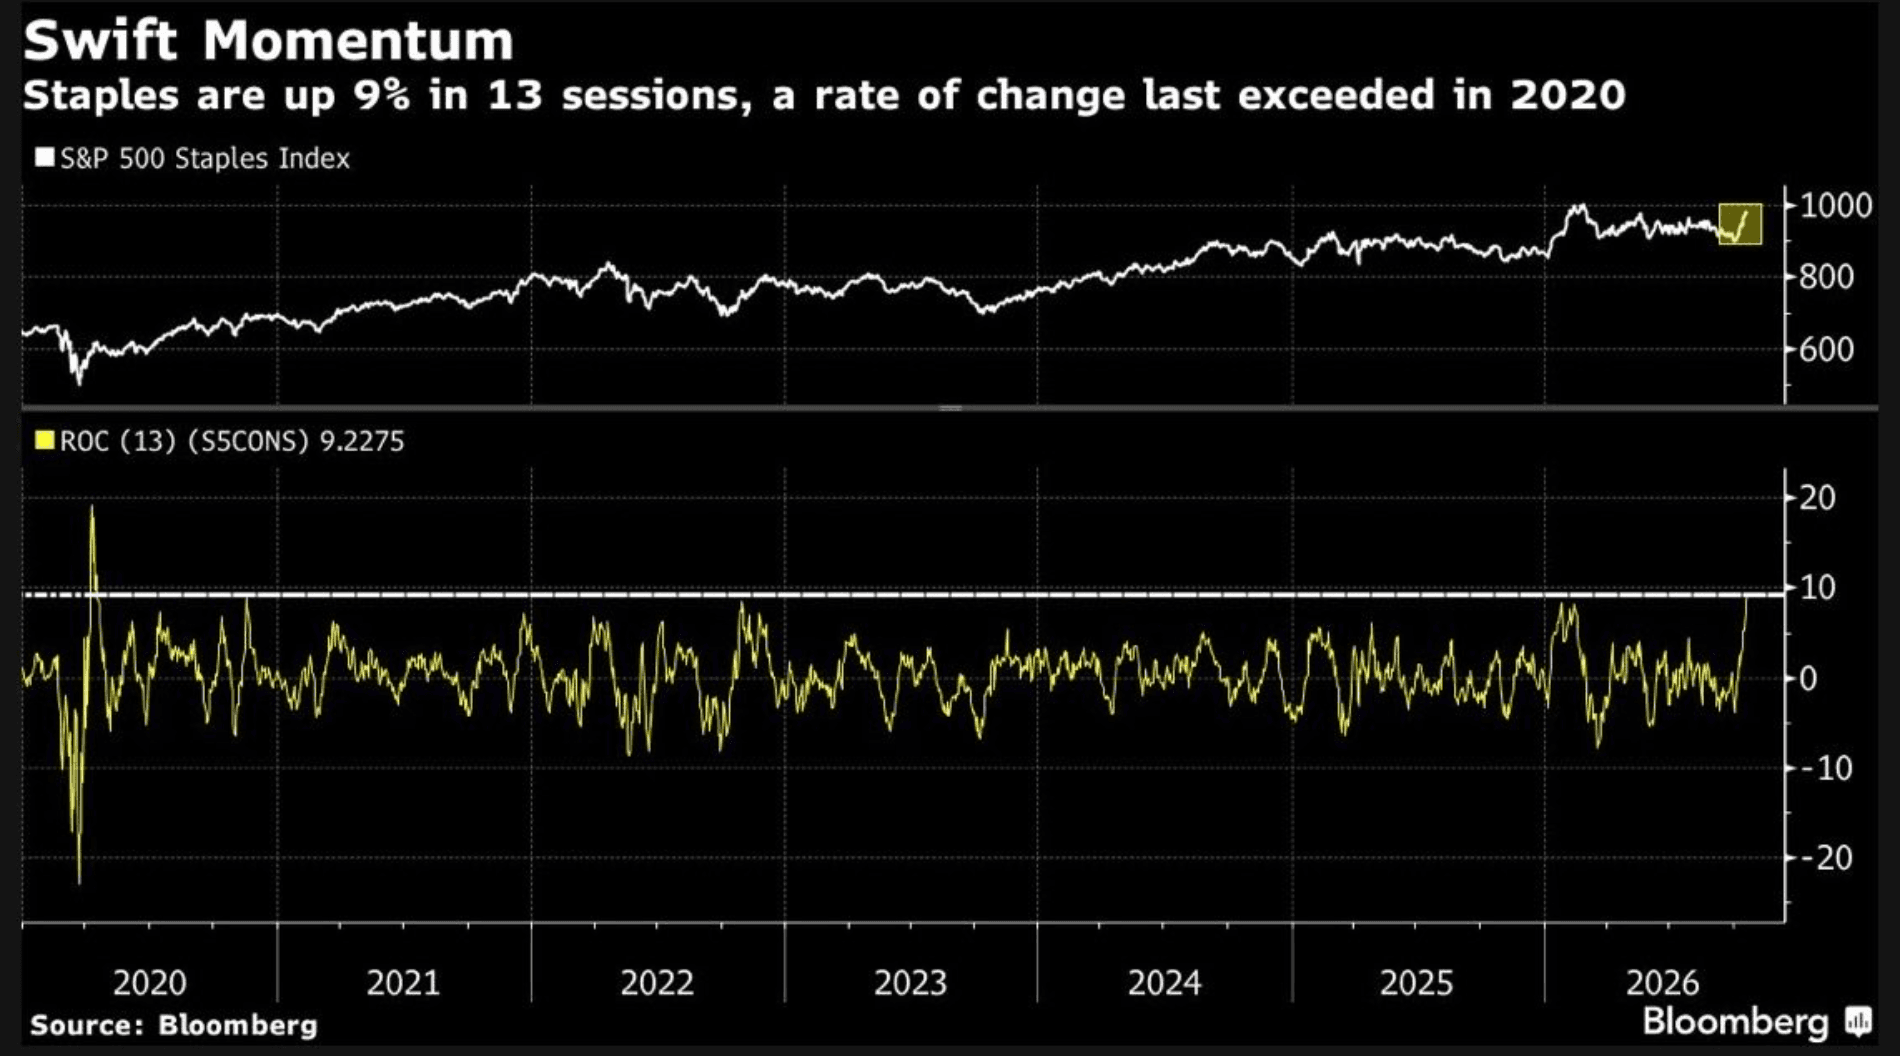
The sector had just rallied roughly 9% in 13 trading sessions. But 76% of its stocks were behind the S&P for the year.
Those recent rallies and the year-to-date figures cover different periods. The point is that recent sector strength hasn’t erased the gap in performance among its stocks.
And underperforming doesn’t necessarily mean losing money. A stock can rise and still lag an index that rises more.
But it does mean that a bullish sector headline can hide a lot of stocks delivering disappointing results.
So before buying one, I want to know whether the company itself gives buyers a reason to own it.
Insight of the Day
A strong sector can hide a weak reason to buy.
A sector rally can lift a stock even when little has improved at the company.
That can make “healthcare is going up” feel like a good enough reason to buy.
But when you have limited capital at your disposal – as we all do…
Sector strength is simply not enough…
Especially, as we’ve seen above, that even in a surging sector…
The chance of us picking a stock that will still underperform (presuming we choose at random) can easily be 50% or more.
That’s why, when I go hunting – I want a catalyst that changes the outlook for the business itself.
A major contract, for example, can add revenue investors weren’t expecting – giving them a reason to pay more for its shares.
That’s an independent reason for the stock to move, even if the rest of its sector stalls.
The challenge is finding those opportunities among hundreds of lesser-known companies.
That’s where the “underground” signals I track come in.
These are trading signals that most traders never notice…
But has preceded massive stock moves like 287%… 542%… and even 806% in a matter of weeks or days.
This strategy is also designed for smaller accounts.
So you don’t need a huge portfolio to start putting this approach to work.
And in just a few hours at 11 a.m. Eastern today…
I’m hosting a free LIVE session to walk you through how it works…
How you can use it in your own trading…
And some of the top trades it’s signaling right now.
Click here to guarantee your free seat if you haven’t already…
And I’ll see you in just a bit at 11 a.m. Eastern.
P.S. If you’re planning to attend on a mobile device, make sure you download the presentation app now so you don’t miss anything when it starts. See you there.
iOS: apps.apple.com/us/app/goto/id1465614785
Android: play.google.com/store/search?q=goto&c=apps
Customer Story of the Day
“Best service available, and I have tried them all.
Ross is the only one who spends his time trying to TEACH you how to do it rather than telling you buy this sell that.
It's like the old saying, "Give a man a fish you feed him for a day, Teach a man to fish, you feed him for life."
As a lifetime private trading club member I would Highly, Highly recommend TA to anybody, and I have recommended it to several of my friends and family.”
Embrace the surge,

Ross Givens
See more from Traders Agency on Google
Make us a preferred source and our market analysis will appear more prominently in your Google Search, Top Stories, and AI results.
Add to Preferred Sources