Hey, Ross here:
The broader market may look relatively calm at the surface – even with the recent pullback.
But under the surface, it’s a completely different story.
Chart of the Day
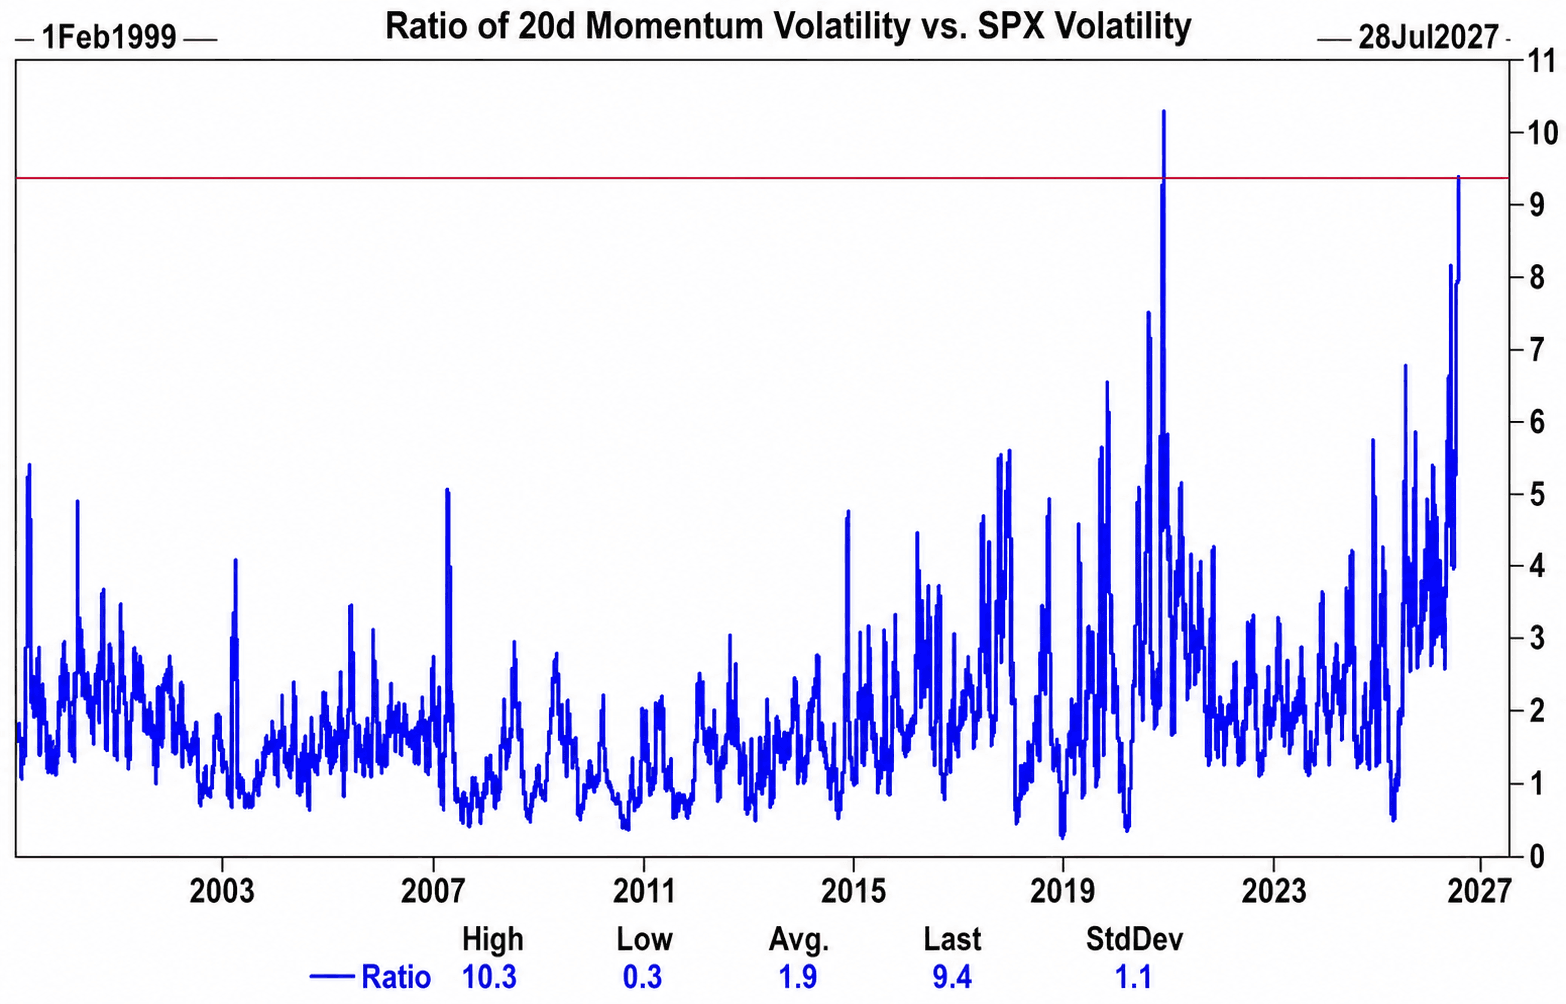
This chart compares the volatility of momentum stocks with the S&P 500.
“Momentum stocks” are simply the names that had been leading the market higher.
And right now, they are swinging roughly 9.4 times harder than the broader index.
That is close to the most extreme reading in the chart’s history.
So the S&P 500 may only move a little…
While some of the market’s biggest winners rip higher one day and fall off a cliff the next.
Here is one reason why:
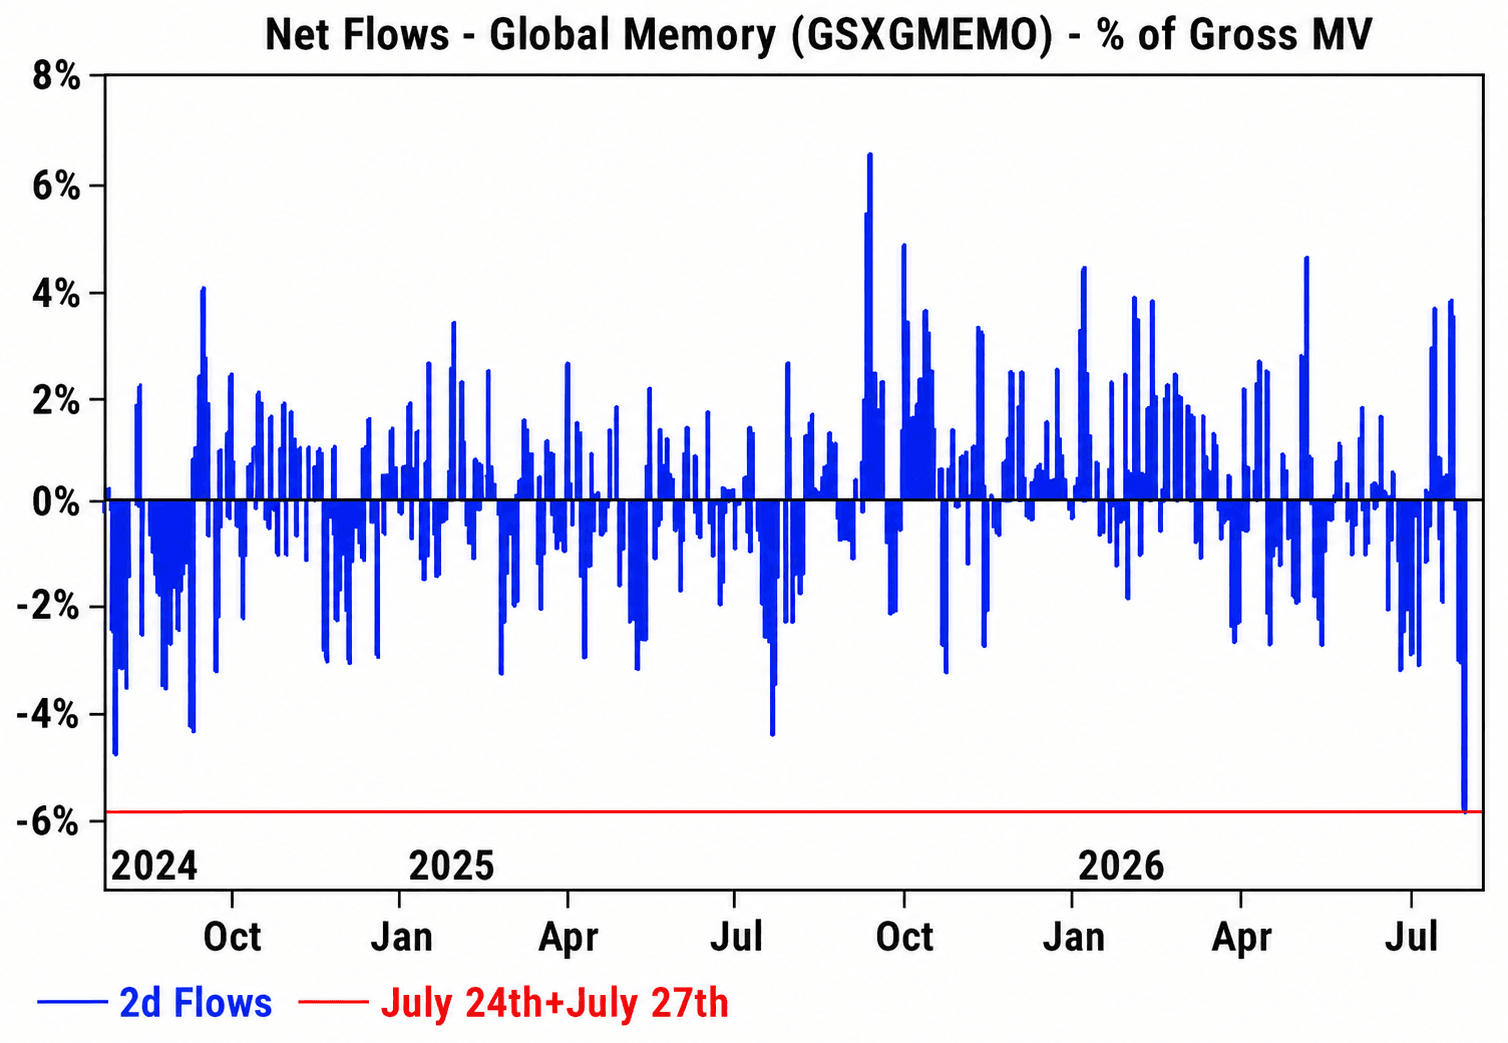
This chart tracks hedge-fund trading in memory stocks.
After being one of the hottest trades in the market…
Hedge funds are now rushing for the exits.
The latest two-day stretch brought the heaviest selling since the trade first became popular.
That kind of move is not always a careful verdict on each individual company.
Sometimes funds are cutting risk.
Sometimes their positions have grown too large.
And sometimes they simply want out before everyone else reaches the door.
When that happens, the selling can hit everything inside the trade.
Strong companies.
Weak companies.
It does not matter.
They all get dumped together.
And that can create a very interesting setup.
I explain below.
Insight of the Day
Sometimes the fund has a problem. Not the company.
When a crowded trade starts unwinding, fund managers do not always have time to study every stock again.
They sell what they own.
They cut exposure.
They raise cash.
And the stocks with the largest positions can get hit hardest.
That means a falling price does not always tell you the business is falling apart.
Sometimes the stock has simply been caught in someone else’s rush for the exits.
The hard part is telling the difference.
Because one beaten-down company may deserve every bit of the decline.
Another may still have growing sales, improving profits and a major catalyst ahead.
From the outside, both can look broken.
But the people running those companies have a much clearer view.
They know whether customers are still buying.
They know whether orders are slowing.
And they know whether the business is stronger or weaker than the market currently believes.
So when an insider starts buying after a violent selloff…
I pay attention.
They may be taking the other side of forced selling with their own money.
And that can help point us towards the stocks that were dumped for the wrong reason.
That’s why in just a few hours at 11 a.m. Eastern…
I’m going LIVE to show you exactly how to follow these insiders…
Using a strategy that has never had a losing year – even in brutal bear markets…
And could have you sitting on open gains like 699%… 275%… and even 1,255% right now.
Plus, with earnings season still in full swing…
There has never been a better time to make use of this strategy.
So click here to lock in your free seat if you haven’t already…
And I’ll see you in just a bit at 11 a.m. ET.
P.S. If you’re planning to attend on a mobile device, make sure you download the presentation app now so you don’t miss anything when it starts. See you there.
iOS: https://apps.apple.com/us/app/goto/id1465614785
Android: https://play.google.com/store/search?q=goto&c=apps
Customer Story of the Day
“Ross Givens & Traders Agency have helped me learn & identify market patterns with analysis as to WHEN and how to properly enter and exit trades, with profit!
It’s been 6 months so far, and the education has been excellent, with the profitable trades following!”
Ross Givens
Editor, Stock Surge Daily
See more from Traders Agency on Google
Make us a preferred source and our market analysis will appear more prominently in your Google Search, Top Stories, and AI results.
Add to Preferred Sources