

Hey, Ross here:
Tech stocks have been getting hammered.
And the selling goes well beyond Nvidia.
As of yesterday, new lows had outnumbered new highs for 56 straight trading days.
That’s an ugly stretch.
But while traders debate how much further tech could fall, one corner of the market has been working on a very different chart.
Take a look.
Chart of the Day
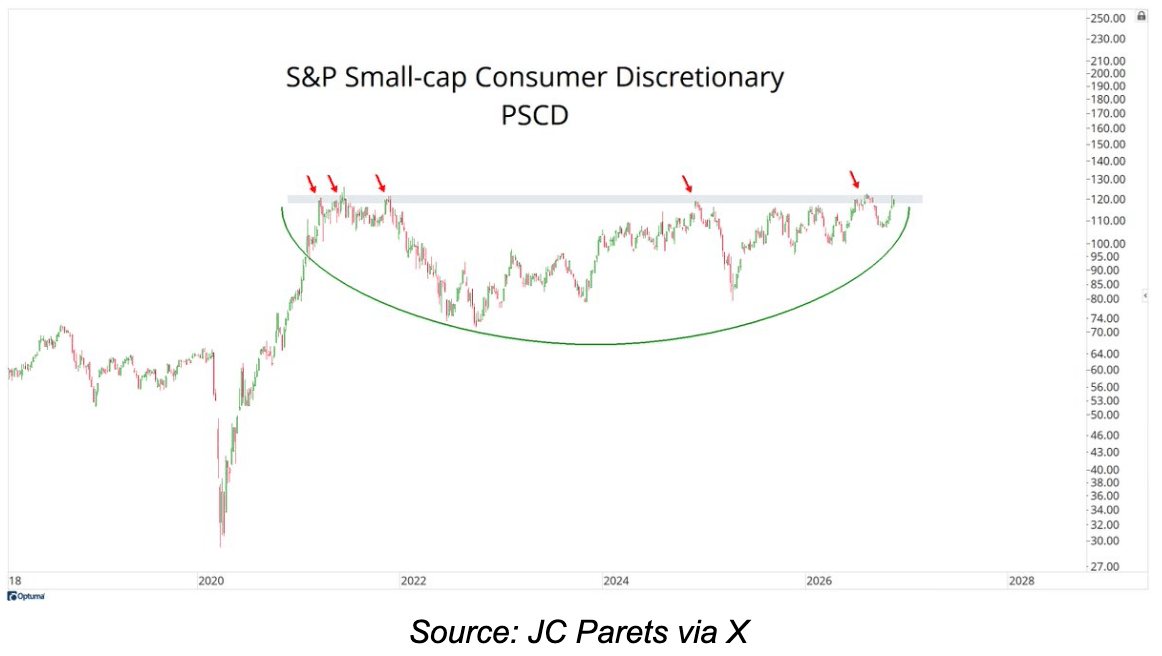
This is PSCD, an ETF that holds small-cap consumer discretionary stocks.
Think smaller companies selling things like clothing, restaurant meals, and leisure activities.
Look at the gray band around $120.
Sellers have repeatedly stopped this group around that level since 2021.
You can see the early attempts on the left, another test in 2024, and more attempts on the right.
Each time, buyers ran into enough selling to send prices back down.
But look at what happened between those tests.
After the deep decline in 2022, the group spent years recovering and working its way back toward the same ceiling.
You can see that large rounded base marked in green.
PSCD is setting up for a breakout through a ceiling that’s held for five years.
Look at how buyers have fought their way back after every selloff.
They’re taking another run at the resistance level.
A break above that level would put this entire group into new-high territory.
And most traders glued to Nvidia probably haven’t even looked at it.
Insight of the Day
There’s ALWAYS a breakout somewhere.
When you hear that investors are “fleeing stocks,” it’s easy to picture the entire market emptying out.
But someone is buying every share being sold.
That doesn’t stop prices from falling. Buyers can demand a lower price, and sellers can agree to take it.
It does mean the market hasn’t run out of investors.
Plenty of them are still looking for somewhere to put their money.
Some cut their tech holdings and buy other stocks.
Others put fresh money into companies they think are worth owning.
And when enough of that buying concentrates in one group, it can push prices higher even while the broader market struggles.
We might have fewer breakout setups to choose from.
But they’re there – and I still want to find them.
The problem is that the headlines keep pulling traders back to the same handful of stocks.
If you spend all morning watching Nvidia, reading about AI, and checking the Nasdaq, how likely are you to notice a chart like PSCD?
You could follow every twist in the biggest story on Wall Street and still miss a setup forming somewhere else.
That’s why I keep scanning.
I want to recognize these patterns before a big move makes them obvious to everyone.
And later today at 3 p.m. Eastern, I’m going LIVE to show you a chart pattern I use to find these opportunities…
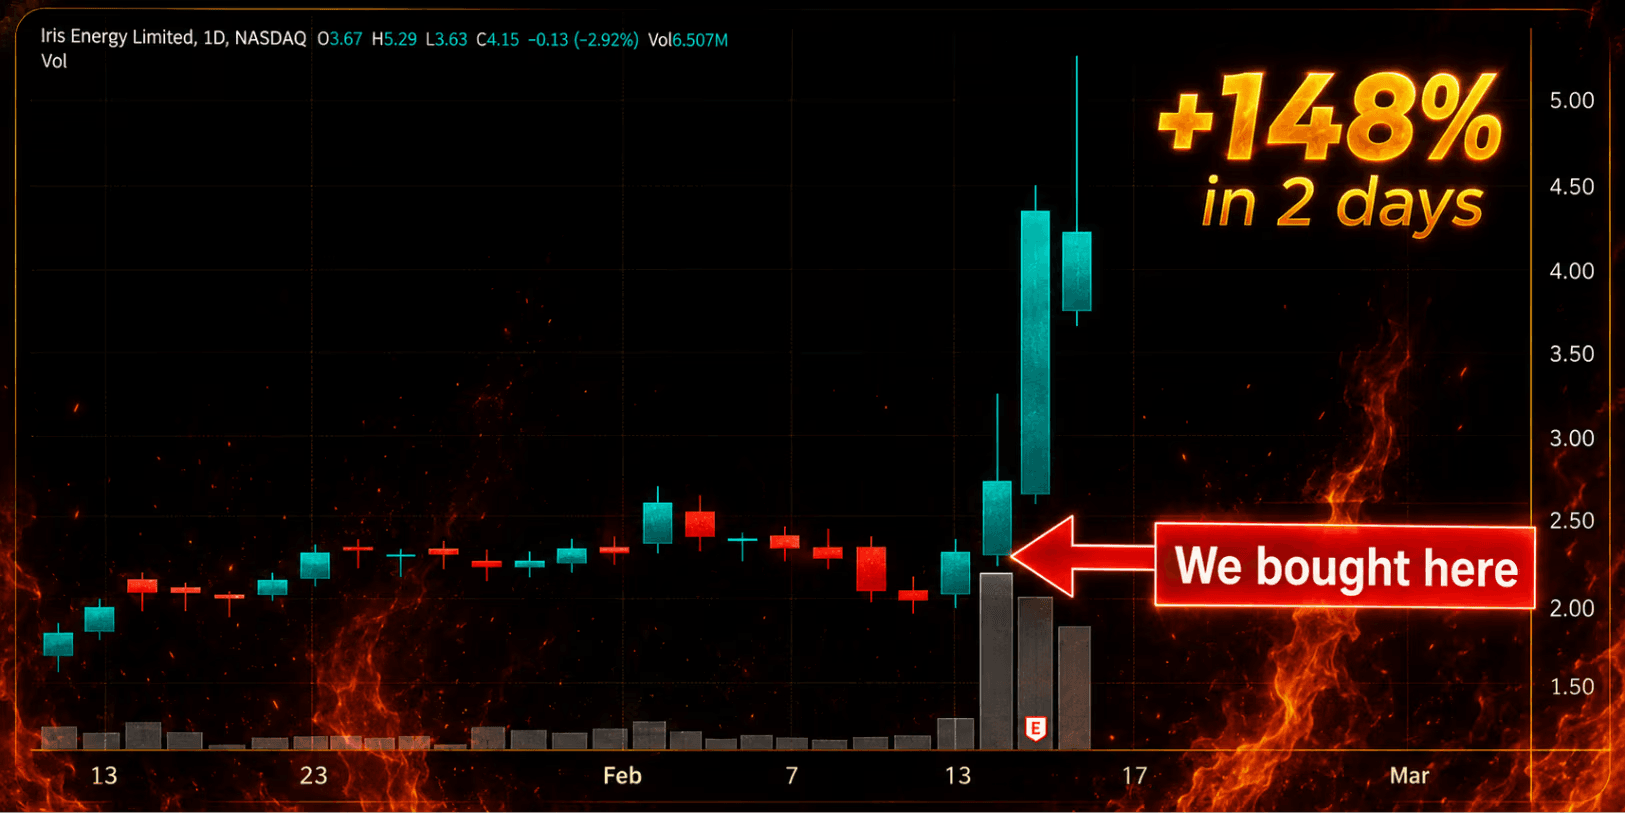
The same pattern I spotted before sending members my alert on Iris Energy, which went on to gain 148% in two days.
I’ll walk you through exactly how this pattern works…
Why it is ranked the NUMBER-ONE chart pattern for both bull and bear markets…
And the name and ticker of one of our top targets setting up in this pattern right now.
The session is free – but seats are limited.
So click here to guarantee your free seat if you haven’t already…
And I’ll see you this afternoon at 3 p.m. ET.
Customer Story of the Day
“Fantastic! Doing well investing with Traders Agency and Ross Givens.
Best decision I have made on this investing journey. Thanks.”
Embrace the surge,

Ross Givens
See more from Traders Agency on Google
Make us a preferred source and our market analysis will appear more prominently in your Google Search, Top Stories, and AI results.
Add to Preferred Sources