
Hey, Ross here:
Microsoft, Meta, Apple and Amazon all report this week.
So naturally, that’s where most traders will be looking.
But there’s another part of earnings season that could matter just as much…
And it has nothing to do with whether those companies beat estimates.
Over the next several days, one of the market’s biggest buyers is about to come back.
Take a look:
Chart of the Day
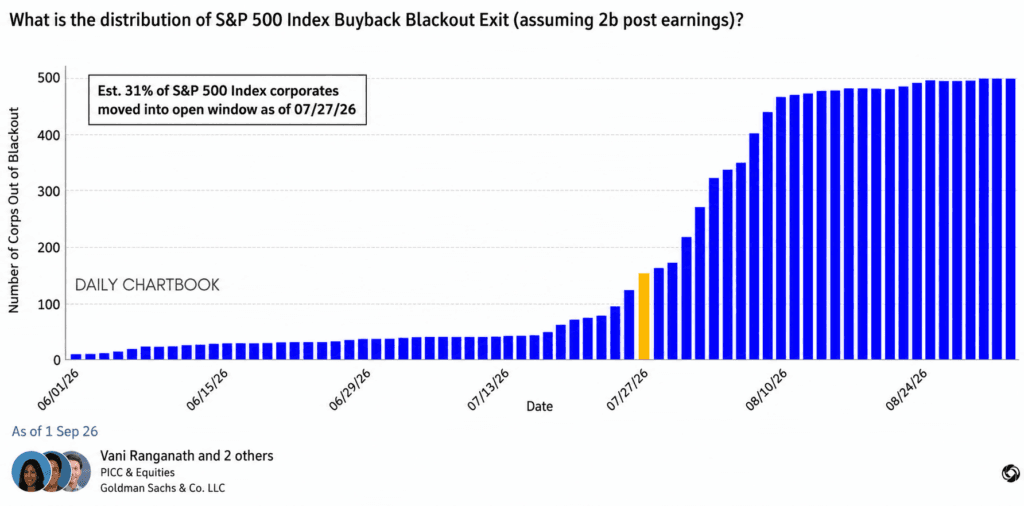
This chart tracks how many S&P 500 companies are leaving their buyback blackout periods.
A blackout period is simply a stretch when companies generally pause share repurchases around earnings.
Once that window reopens, they can start buying again.
Right now, roughly 31% of S&P 500 companies are back in their open windows.
By the end of next week, that number should jump to around 53%.
So more than half the index may soon be free to start repurchasing shares.
That is a lot of buying power.
Companies have become one of the biggest buyers of stocks in the entire market.
And when they step back in after earnings…
That demand can help support prices, absorb selling and push individual stocks higher.
But now look at this:
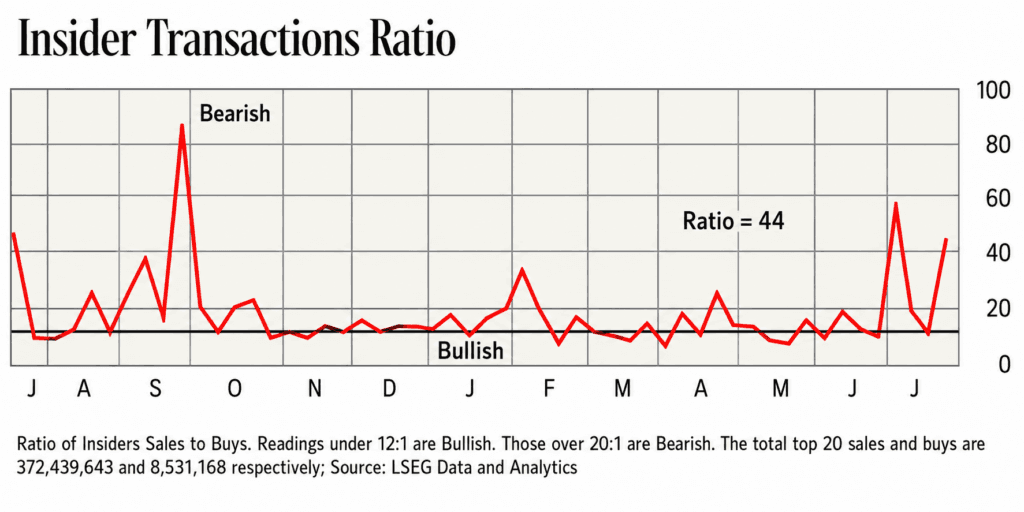
While companies prepare to buy more shares…
Individual insiders are doing the opposite.
The ratio of insider sales to insider purchases has climbed to roughly 44-to-1.
In plain English, insiders are selling about $44 worth of stock for every $1 they buy.
So corporate buying is coming back…
But personal insider buying has become extremely rare.
Yet, as I explain below…
We can actually use this to our advantage.
Insight of the Day
The less noise, the easier it is to find the signal.
At first glance, a 44-to-1 sales-to-buys ratio looks ugly.
But for me, it does something useful.
It clears the field.
Most insiders are not buying.
So the few purchases that do appear can become much more valuable signals.
Not all of them of course.
Most will still be meaningless.
But others can point to something big building beneath the surface.
The trick is knowing which is which.
I’m going LIVE to show you exactly how I separate the noise from the insider buys worth paying attention to.
It’s the same method we’ve used to find gains of:
115% in less than 60 days…
168% in five months…
234% in eight weeks…
And even 1,787% in just two years.
The biggest opportunities this earnings season may not come from Microsoft, Meta, Apple or Amazon.
They may come from smaller stocks almost nobody is watching yet.
Click here to guarantee your free spot if you haven’t yet…
And join me LIVE today at 3 p.m. ET.
P.S. If you’re planning to attend on a mobile device, make sure you download the presentation app now so you don’t miss anything when it starts. See you there.
iOS: https://apps.apple.com/us/app/goto/id1465614785
Android: https://play.google.com/store/search?q=goto&c=apps
Customer Story of the Day
“By FAR !! the best way to understand the workings in the stock market. Ross and the team are the real deal, no BS.
I’m a lifetime full subscription member and couldn’t be more satisfied.”

Ross Givens
Editor, Stock Surge Daily
See more from Traders Agency on Google
Make us a preferred source and our market analysis will appear more prominently in your Google Search, Top Stories, and AI results.
Add to Preferred Sources