Stock Market Blog
Daily stock market analysis, trade alerts, and trading education from Ross Givens and the Traders Agency team.

More and More Evidence for the Bounce
Hey, Ross here: My short-term thesis for the market is playing out. And as the Chart of the Day shows, today’s price action could all but confirm it. Chart of the Day This is the S&P 500 displaying a classic head and shoulders chart pattern – typically a bearish pattern. The horizontal white line marks […]

Bounce or Bull?
Hey, Ross here: Welcome to a new trading week. Despite the hotter-than-expected jobs report last Friday, the market defied expectations and closed higher – even ending higher for the week. This tells me that my thesis for a short-term technical bounce is sound. But again, I don’t believe this is the resumption of the bull […]
Hot Jobs (Market Update from Charles Green)
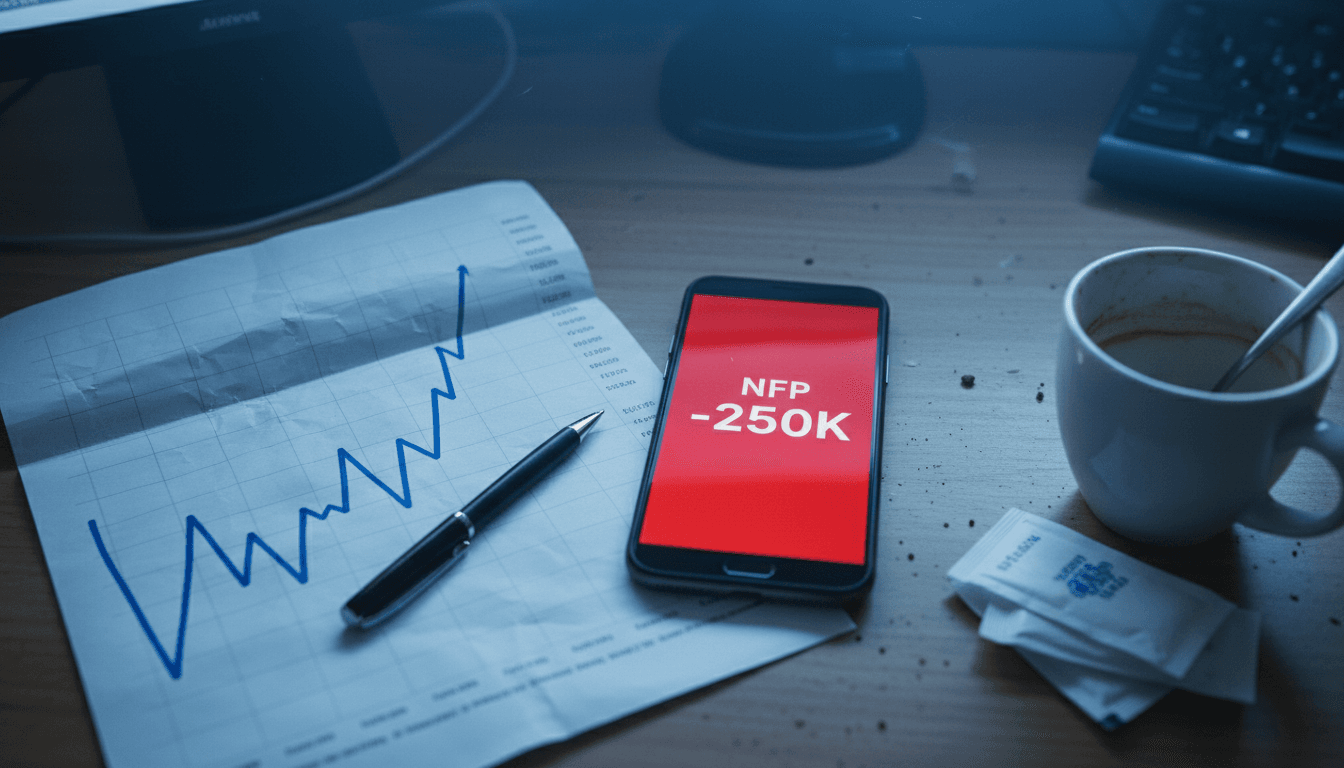
Charles Green here, Senior Market Analyst here at Traders Agency. Here’s today Market Pulse 360. Market Pulse 360 for October 6, 2023 The Non-Farm Payroll report this morning was released at 8:30 AM ET this morning. The number was much higher than expected: 336k vs.170k, double the number that was expected, which is not favorable […]

3 Reasons for a Market Bounce
Hey, Ross here: As we end the trading week, we can see that there are three support levels that point toward a market bounce. Chart of the Day What you see here are three different lines of support for the S&P 500. The horizontal white line is the 4,200 mark – formed by both the […]

Too Much Fear?
Hey, Ross here: Let’s start the day by looking at a chart that lends support to my hypothesis that we’re due for a short-term bounce. Chart of the Day This is the popular CNN Fear & Greed Index represented in chart form. Right now, the index is sitting at 26 – bordering on “Extreme Fear”. […]
The Market’s Next Test
Hey, Ross here: Let’s start the day by looking at a critical level of support for the S&P 500 – the next test for the market. Chart of the Day After posting another red candle yesterday, the S&P 500 is just 0.7% away from the 4,200 mark. That 4,200 mark is also where the 200-day […]

This is What I Expect
Hey, Ross here: More Fed officials opened their big mouths yesterday to yap about the need for higher-for-longer rates and even calling for more rate hikes – sending 10-year Treasury yields to levels last seen in 2007. Can’t someone put a lid on them already? Despite that, the Nasdaq still managed to close higher and […]

Technical Bounces vs. Sustained Uptrends (Important Difference)
Hey friend, The government narrowly averted a shutdown, which probably gave stocks a little boost despite Treasury yields continuing to surge. How have markets been moving? In a word – mixed. The Daily Direction Note: The NASDAQ closed higher, the S&P 500 closed flat, while both the Dow and Russell 2000 index closed lower yesterday, […]

More Fear, More Opportunity?
Hey friend, Welcome to the fourth quarter of 2023. Here’s what happened to the indexes during the third quarter: S&P 500 is down 3.6% NASDAQ is down 4.1% Dow Jones is down 2.6% Russell 2000 is down 5.5% The Daily Direction Note: With the exception of the NASDAQ, all indexes ended lower on the last […]
Was the 2023 Bull Market Fake News?
Hey, Ross here: Welcome to the start of October and the fourth quarter of the year. With nine full months behind us, it’s time to lift up the hood and look at what’s really happened in the 2023 “bull market”. Chart of the Day This chart says it all. The vast majority of the gains […]
Are You Falling for the Recency Bias Trap?
Hey friend, The third-quarter pullback took another pause yesterday. With just one more trading day to go until the fourth quarter – historically the strongest quarter of the year – everyone is looking to how the markets will move to get some insight on any new direction. The Daily Direction Note: All indexes closed higher […]

Good Riddance (and Get Ready)
Hey, Ross here: Today is the last trading day for the month and the quarter. The third-quarter of the year has traditionally been a weak one for the markets, with September being even worse (check out the Chart of the Day). So all I have to say is – good riddance. Chart of the Day […]
Stop watching.
Start winning.
50,000+ traders get our daily brief before the market opens.
You're subscribed!
Check your inbox.
Free. No spam. Unsubscribe anytime.
