Good morning, Traders!
I’m pretty excited about what’s happening with the E-mini Russell 2000 (RTY)! It was hard to make the call that the RTY was about to sell off because we have a bullish upchannel. But my data showed that the sell-off was on the way. Now we just wait for the price dip to U-turn off support and move back into a bullish rally.
We stayed disciplined, ignored our emotions that told us to buy, and the sell-off happened just as my strategy predicted!
That’s what makes my system so great. It teaches you to trust the data and greatly increases your chances of making winning trades. Thanks to my strategy, we avoided losing money in the RTY! And you can see it in action for yourself by following along as I make trades every day.
Now let’s take a look at the RTY timeframe analysis and see when we can expect the market to move into the buy zone again:
Daily Timeframe Analysis
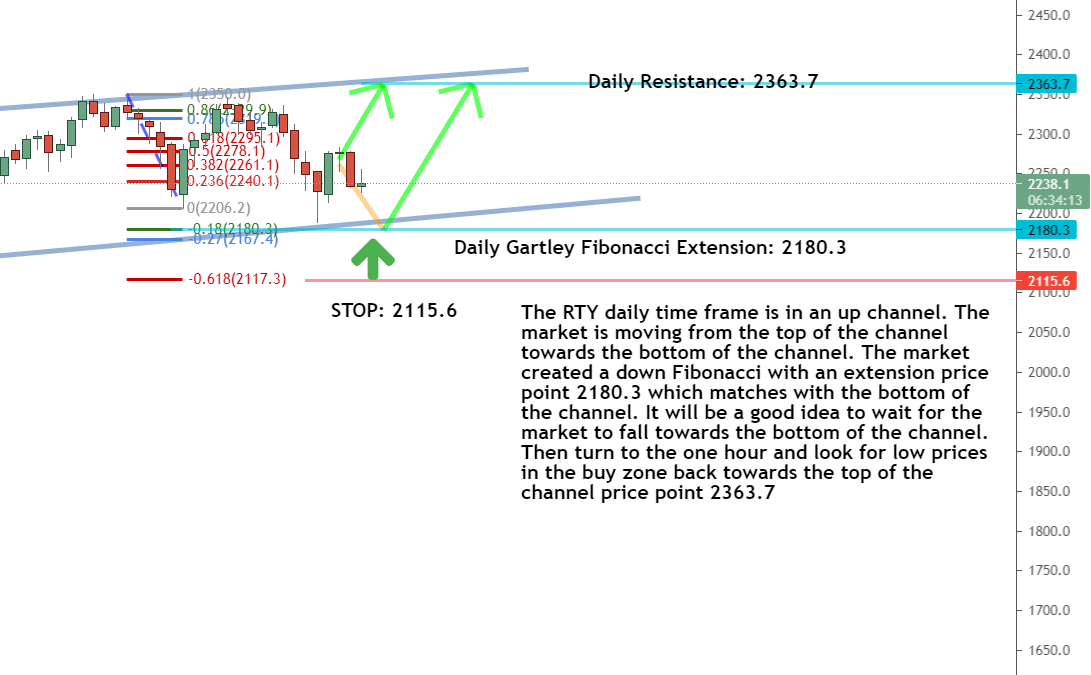
While the overall direction of the RTY is up, we see signs that a sell-off is well underway.
When looking at the daily timeframe chart, we see that the market is headed for the bottom of the channel (bottom grey line). Though it looked like the market was trying to U-turn back to the top, our chart history shows that only happens when the price touches support.

The RTY is headed back down toward support (the bottom grey line) as the expected sell-off plays out
That’s why following my strategy will help you avoid making rash decisions that could cost you money. It sticks to the data and leaves emotions outside of the equation. To learn more about how I use my strategy to predict future price movement, check out this article I wrote.
One-Hour Timeframe Analysis
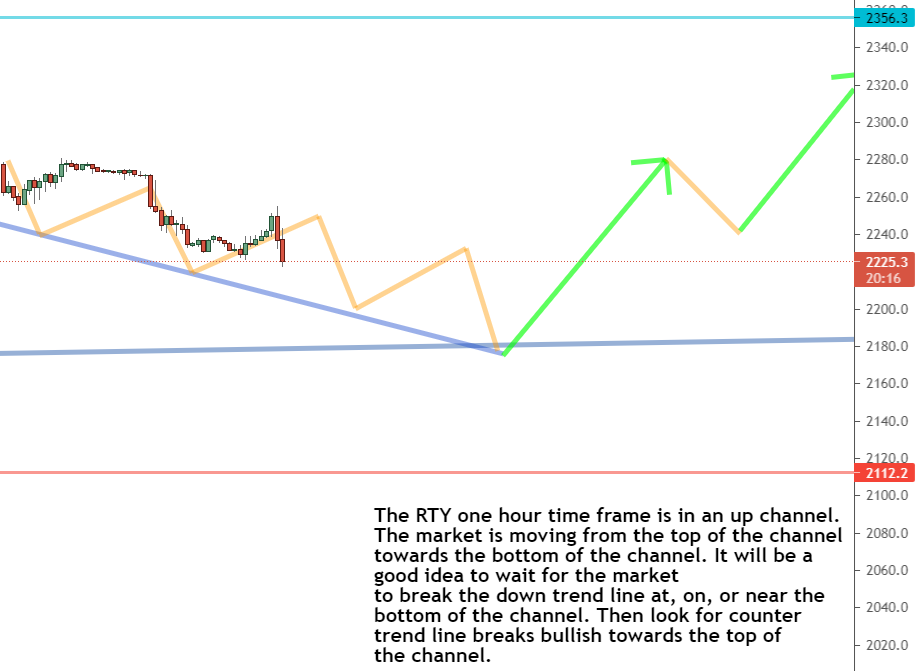
The one-hour timeframe analysis confirms what the daily timeframe is telling us. The RTY is clearly in a sell-off and headed for the bottom of the channel. We should expect the price to continue dropping until it U-turns off support and shows signs of returning to the buy zone.

The RTY is turning down toward support. We should watch the market and anticipate a U-turn back to the buy zone
But remember that this doesn’t mean we should be upset about this price drop. We like lower prices when we know that the overall trend for the market is up! That gives us an opportunity to buy at a low price and wait for the market to rally. You can read more about how that all works out here.
The Bottom Line
The long-term direction for the RTY is up, but the short-term trend is down as the market sells off to a lower price.
But this is an opportunity to buy the RTY at a lower price within an overall bullish trend! We’ll need to focus on our timeframe charts and wait for the market to return to the buy zone.

The long-term direction for the RTY is up, but the short-term trend is down
But don’t jump in all alone. I’m here to help you realize your money-making potential in futures trading. Leverage my knowledge for your own gain. Just follow along as I reveal the crucial aspects of my trading strategy that will allow you to become a profitable futures trader!
Keep On Trading,

Mindset Advantage: Burn Your Baggage
You carry it around like George Clooney, in that movie ‘Up in the Air’.
The impossible weight of life and trading – all in one backpack.
Why not unburden yourself?
Don’t just set the baggage aside.
Get rid of it all together.
It can’t weigh you down if it’s not there to pick up again.
This goes especially for trading.
Learn from the losses, the bad entries, and the late exits.
Then get rid of them.
Burn that baggage.
Traders Training Session

What are future contract sizes?


