Hey everyone, Josh Martinez here with tradersagency.com and welcome to the video. We have some pretty exciting news. Ross Givens is joining the team. Now he is a very, very experienced stock trader, so we invited him onto the channel to share his experience, his research, and his knowledge with you.
So you’re going to see more and more of him. Why is he here? Well, I focus mostly and mainly in the futures market, but I know there’s a lot of people that want to learn techniques in the stock market. So enjoy the video and welcome to the team Ross.

Hey everyone, I hope you enjoy this content. Don’t forget to click that subscribe button and hit that bell to be notified of upcoming videos.
Hey there, Ross Givens here with Traders Agency and today I want to walk through one of the most powerful chart patterns there is. In fact, this pattern, although it’s fairly rare, can lead to the largest and fastest gains I’ve seen. I’m talking about stock moves of 30, 50, 100 plus percent, in just a short number of days or weeks.
Now the chart patterns known as the high tight flag, I’m going to walk you through how it works, what you’re looking for and additionally, why it works. A lot of people talk about, oh, I trade cup and handles or I trade this head and shoulders pattern. I’ve seen people talk about Batman formation, they don’t know why they trade them. I think it’s really important to understand why a certain chart pattern works or doesn’t work, and what exactly you’re seeing, because only by knowing what’s behind that pattern and the actual activity going on behind the scenes can you really have faith in it and really trust your trade, and only when you really trust your trades and your setups and why you’re doing something, are you going to be able to hold on for those larger moves to make some big profits.
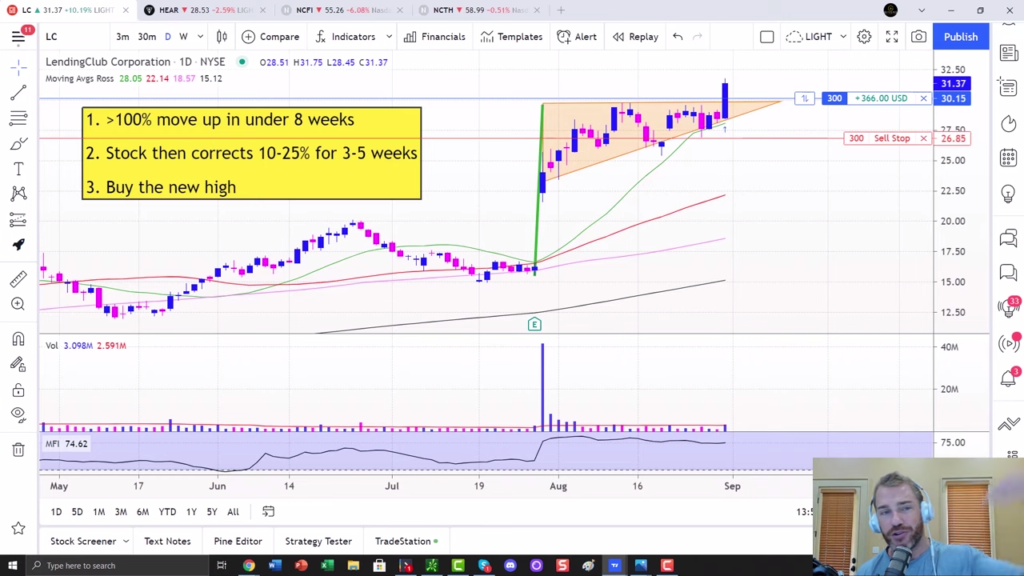
Let’s go and break it down for you. Part of making this video today, because I just entered one of these trades this morning. Now, the chart you’re seeing right here is LendingClub, ticker symbol LC. Now LendingClub have been having some really strong price action here recently. In fact, its relative strength is in the 99th percentile. Now I use a software called MarketSmith, just to run through the basic fundamentals. And I’ll bring that up on the screen right here. You don’t need to understand how all this works, this is not my software, it’s from investors business daily. It costs around 150 bucks a month or so, but it gives me a couple of things. And one of the main ones is, it shows me the key fundamentals down there in the bottom right.
When it comes to the underlying fundamentals, I don’t care about the book value per share, I don’t care about inventory turnover, I don’t care what the P/E ratio is. I’m looking for one thing and one thing only, and that’s growth. I want to see earnings getting bigger, I want to see sales getting bigger. And so this quickly identifies those stocks.
So we see the [inaudible 00:02:52] been pretty flat to the last few quarters and now it’s coming back to life. The last quarter it grew sales by 400%, earnings went from negative 60 cents a share, so 60 cent loss to a nine cent profit. And look at this strong price action, it’s just surging higher. It’s gone from 15 bucks to 30 bucks in just a couple of days. Earnings expectations you can see are in the top left. Again, it’s been kind of dull for a lot of years but look at that 2022, finally supposed to turn a profit for around a dollar 16, which is going to be huge.
Anytime you’ve got a stock, especially a smaller stock that’s been unprofitable for a lot of years and suddenly becomes profitable, you can see really large moves in that stock. And if you don’t believe me, go back and look at Tesla at 2020, see what can happen when a company finally turns profitable.
Now, here is that pattern again. Now if we scroll back, look, here’s a daily chart. Look, this stock has been a dog since 2015. It’s a $140 stock, [inaudible 00:03:46], absolute dog, but it’s coming back to life and as drawn out on this chart, the high tight flag. Now, as you probably assumed it gets that name because it looks like a high and tight flag. So generally what happens, the stock will make a large move higher, followed by a retracement of less than 25%, a tight little consolidation, and then when it breaks out above this to a new high, that’s the trigger to buy.
Now I’ve drawn out the rules in charge. Let me bring these up for you so you can see them. And this is what you’re looking for with the high tight flag formation. First thing is a move of greater than 100% in under eight weeks. Now, some tax will tell you, you will need this thing to be a 100 to 120%, but I don’t discount them if it moves further. This thing saw 300 or 500 or 800% move in the last two months, I’m not going to ignore this trait. If anything, I’m going to like it that much more. But here’s the important part, after that big move forming the flag pole, which is this right here. See this green line right here, that’s the flag pole, the big move higher. And I’ll go ahead and measure that one out for you so you can see what I’m talking about. It comes right at, let’s see, from this low to the high, it was right at 100%, the up move there, the last few weeks.
Okay and really if we take it from back here in May, the last eight weeks, so it could be a little bit higher, it’s probably what 103, 104. So roughly 100% up move, right? Step two, the stock then corrects 10 to 25%. The important thing is it does not correct more than 25%. So again, this is, I’ve got this little drawing tool here on the trading view platform. If you’re not using this, you can just grab a calculator. The high was 30, it came out at 25. 25 minus 30, divided 30, what’s my percentage?
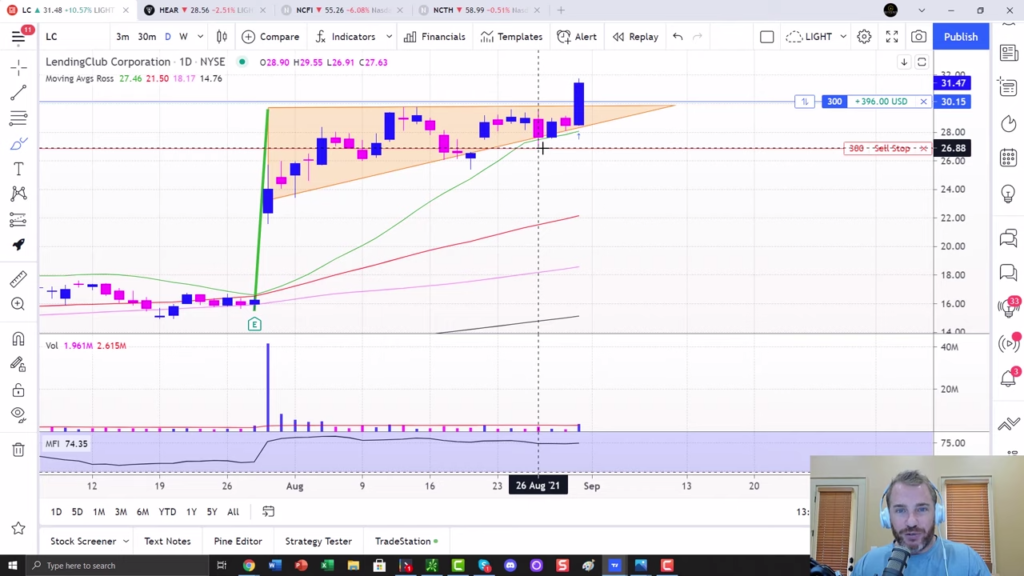
But I’ll just draw it here for you really quick and we see from the high of this, to the pullback, to the low there, right at 15%, so that checks the box. So here’s why this is important, it is natural when a stock makes a large move higher to then retrace, you’re going to take profits. If I told you to buy the stock at 15, you check your account a week later, it’s at 30, you’re probably going to sell some. You’re going to take some profits, put some dollars in your pocket and that’s what everyone else does. So that’s a natural reaction, these pullbacks on the way up, but when it’s a shallow pullback, when you get a huge move of a 100 plus percent, the stock is doubled or more, and that only pulls back around 25%. What that tells you is that the market thinks it’s going to go even further. Not that many people are selling, the shallow it is the better.
And in this case, 15% is a very, very shallow retracement after such a large move higher. If the market thought this was up, we don’t know if it’s going to keep going. Let’s just take the money while we’ve got it, it would retrace and you’ll often see these things run up, retrace 50, 80, even all that move or more. But if it doesn’t and it holds up here, again, for three to five week period, that’s a strong sign. It shows you not much supplies in the market, not many people want to sell their shares because you’re still holding on [inaudible 00:07:00]. The diamond hands traders as the term is around Reddit right now.
So here, we’ve got this flag formation and you just take that high and then your entry is on a new high. You may do five or 10 cents above that high and that would be right in here when it breaks the top of that. And you can see where I bought, I bought 300 shares just this morning, right here at $30.15, the high was 29.72, so I got about a quarter late. I should have had this thing at around 29.85, so I’m about 30 cents more than I should have, but that’s what you’re looking for now. So it’s only been four hours or so, and got a nice little profit going for us and hopefully this thing continues.
Now my stop, as you see is right here below that last little swing low, if you really wanted to do this properly, probably could have brought [inaudible 00:07:50] 25.35 but I wanted to trade it a little bit tighter. So where you place the stops is kind of up to you but what you really want do is in these formations and let me scoot this chart so I can kind of draw one for you.
But normally the stock will kind of come up and then retrace a little and hopefully it gets tighter and tighter towards the right like this, kind of forms a pendulum upward. And you want to just put it below, put your stop below that last little swing low there. That’s what you’re trying to do is just take out, you know wherever it swung to last, you shouldn’t get back below there. The last wave of selling ran out in this case, right there. And lower than that counts as 26.91. Do you see, I got to stop at 26.88 just below that. All right, so you just want to put it below the last low of that exhaustion. The last place sellers stopped and buyers came in.
All right, so that’s the high tight flag and again, as I mentioned, these can make huge moves because a lot of people are scared of this trade and it shouldn’t surprise you. What are we taught since we’re babies, buy low and sell high. So when a stock just doubles, what’s everyone going, man, I wish I’d bought that a week ago, I guess I’m late not buying it now, but that’s a mistake because with shallow retracements that’s showing you the stock still has room to go, that the owners of the stock are not selling it and you could get a second wave. It’s large, if not larger than the one you just saw it.
I’ll show you another example. This is Turtle Beach, HEAR. And here’s the stock. This is, lets see, a few years ago, but this is a perfect high tight flag. So I’m going to show you another one here and you can probably see it. So if we look at the price action, what did this thing do? It ran up 625% in just over a month, that’s your flagpole. Let me make this a weekly chart, actually it’d be easier to see. So this was our big run up over here on the right side of the chart and then what do we get? These are weekly candles once again. All right, so weekly candles. So once we got that, what do we see? We saw about like that there, right? So we had 1, 2, 3, and then the fourth week it broke out from that high. Remember, that’s what we’re looking for, three to five weeks of that consolidation zone.
So your entry to buy here, the higher this candle is 20.36. So if I was placing this trade at the time, my line in the sand, this is where I would’ve been buying, call it 2040. I’m just going to throw this out there, I want you all to see it. And then where would your stop be on this one? When you’re buying the thing at 20, again, try to forget that this right side of the chart exists.
Okay, this is what you were looking at the time, this is what you saw. And you’re saying, man, this thing was a $2 stock two months ago, now it’s $20, you have to be an idiot to buy it here, but you’re buying it anyway. Your stop would be what? Just below these little swing lows here, so I would either put it right here around 16 and a quarter or if you want to be a little more generous back here below this one at 14.75. So you put your stop down here. I’m just going to color this out so you can visualize this a little bit better. And obviously it’s easy in hindsight to go back and say I would’ve done it right here, right? Everybody’s a genius looking at an old chart.
That’s why I wanted to show you what I’ve taken right now as I’m talking. But this is how you traded that one. So you’d be risking five bucks a share on this thing and look at what it did, you got in at 20, the thing ran up to 35 bucks, so you still had a really solid move of about 70% over the next, call it, two to three months there before this one kind of ran out of gas and started to roll over.
If you think this is a new thing, it’s not. This chart pattern has worked for over a 100 years. I found some old examples online. This is one of Syntex, I don’t think this company exists anymore, but take a look at this old high and tight pattern and it’s a weekly chart. So we’re seeing the very same thing. Look at this as it graduates up, makes a big move of at least a 100% over this four or five week period here, you got 1, 2, 3, 4, 5 week consolidation breaks through right in here at around 32 bucks. And then over the next, what six months? The stock continued to go four or 500% further, and that’s 1963.
We can go further, we can go… Look at this, 1915 Bethlehem Steel, ask your great grandfather about this stock. Same idea, again, this is logarithmic scale. Look at the numbers over here so it doesn’t look as extreme as it really is, but high tight flag, 1, 2, 3, 4, 5, 6 weeks up from 60 to 140 over a 100%. And we had 1, 2, 3, 4, 5, 6, 7, right in there weeks, it breaks through around $150 mark and then the [inaudible 00:13:09] 600 bucks, so the stock went 4X over the next five to six months there.
So this pattern is fairly timeless. It has worked for a very long time and it’s not going to stop working anytime soon because the idea behind it is sound. The idea is… Yes it’s had a big move, yes it happened on a large volume, but as long as folks are not selling, as long as there’s no supply coming, that’s usually a good sign that we could see a second search higher. You can see them in this one. It’s kind of a small position around 380 bucks before the first day. We’ll see what happens with LendingClub but I’m hoping for a nice solid move higher.
So that is the high tight flag. Again, this is Ross Givens from Traders Agency, invest well and I’ll see you in the next video.
Hey guys, if you enjoyed this video and you want to stay up to date to my weekly content, go ahead and subscribe to this channel tradersagency.com. If you want to be notified every time I post a video, go ahead and click on that bell down below. If you want even more information, don’t forget to visit my website at tradersagency.com and subscribe to my free weekly newsletter where I send out my research on market opportunities. Thank you for the opportunity. Have a wonderful day.