Good morning, Traders!
Today we’re taking a look at gold futures, specifically the GC market. Both the long-term and short-term directions are up for gold. The market is now on the backside of the old down trendline, with a bullish reaction just around the corner. What does that mean for traders like you? Read today’s Daily Direction to find out!
The current up Fibonacci (the next high price limit) for the GC is 1871.6. Once the market pushes bullish, we can expect the market to turn toward that price point and start giving us opportunities to make money.
All this talk about Fibonacci can be confusing, especially if you’re new to trading. So take a moment and study my free resources to find out how Fibonacci extension work. You’ll need the information to develop a trading strategy to help you win more trades!
Before the GC starts to push bullish, we’ll want to watch our timeframe analysis for the market. That’s how we’ll know when and how to execute our buy-in strategy for the market. Without that analysis, we’d be making educated guesses about what to do.
Are you ready to trade? Let’s jump into the analysis now to see what’s happening with gold futures today:
Daily Timeframe Analysis
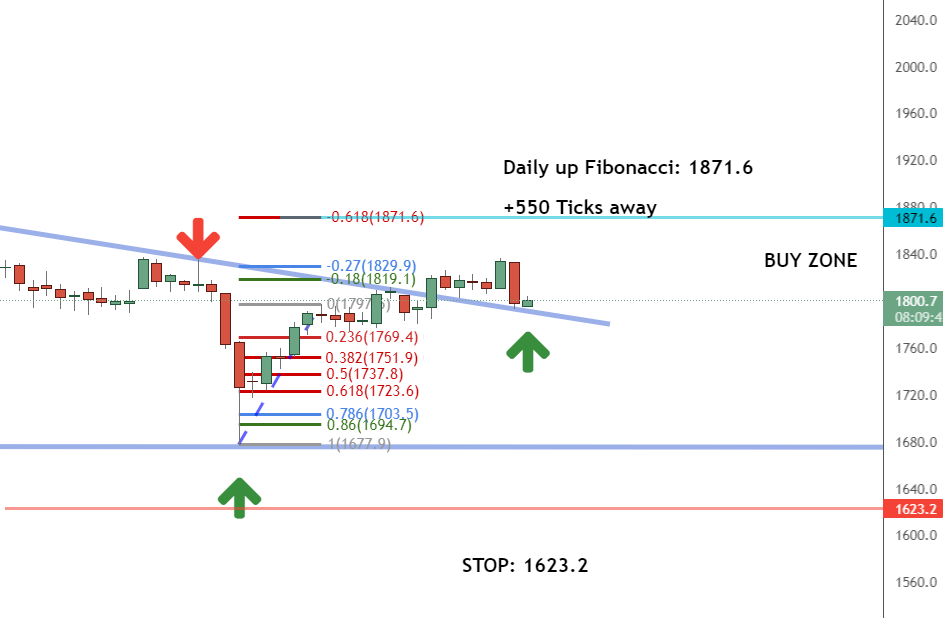
The daily timeframe for the GC is ready to push bullish toward the 1871.6 Fibonacci extension. As you can see in the chart below, the market has hit the backside of the down trendline and is ready to bounce back and head toward higher prices.

The long-term direction is up for the GC

The short-term direction of the GC is currently up

The GC is on the backside of the old down trendline and is ready to push bullish
Learn more about the Daily Direction Indicators here…

The GC is ready to push bullish toward the 1871.6 daily up Fibonacci extension
We’ll monitor the daily timeframe to find our high and low prices before jumping into the one-hour timeframe to find opportunities to buy the market. We’re just waiting for signs that the market has entered into another bullish push.
One-Hour Timeframe Analysis
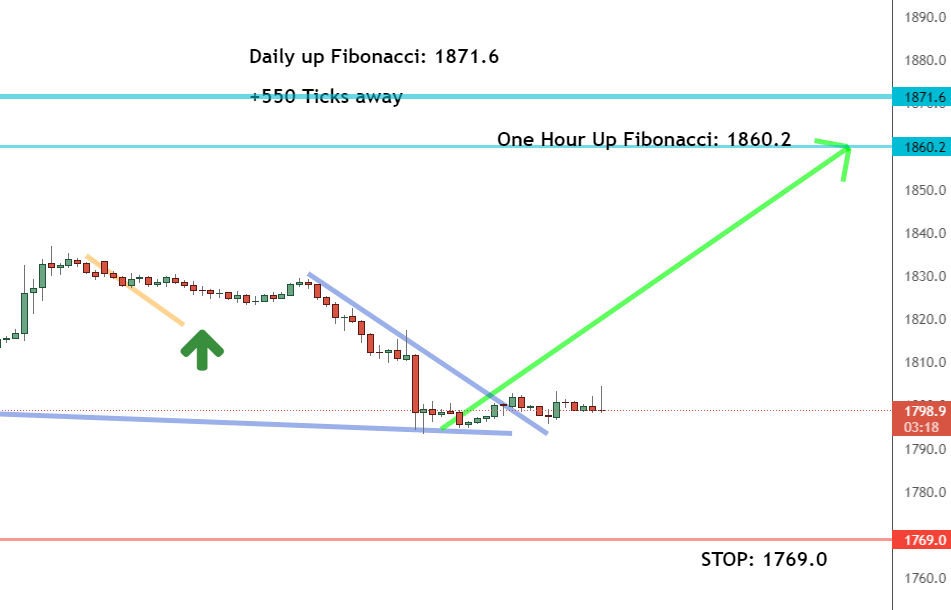
As we look at the one-hour timeframe, we can see that the market is in a position to turn back bullish toward higher prices. Of course, we’ll want to buy the GC at low prices while in the buy zone. If we wait too long, we’ll miss that opportunity and end up buying at too high of a price. But if we jump in too soon, we risk buying the market before it turns bullish.

We’re waiting for signs of a bullish push in the GC. We’ll use the one-hour timeframe to find opportunities to buy the market
Remember that the market moves in waves. We’ll see high and low prices as the market makes an overall positive push toward the Fibonacci extension of 1871.6. We want to grab the market at those low prices to give us plenty of room to make a profit.
The Bottom Line
The GC is poised to push bullish toward the high price limit of 1871.6. The market is on the backside of our down trendline, meaning we should see buyers start to push the market up again. Once we see evidence of that happening, we’ll utilize our one-hour timeframe charts to plot our entry to buy the market and ride it to a higher price. That’s the fundamental principle behind making money in the futures market!

We’re ready to see the GC push bullish and give us a chance to make money in the market!
But none of this will work for you if you haven’t learned how to implement my strategy! So stop making excuses and get started today. If you keep waiting, these opportunities will continue to pass you by as you sit on the sidelines.
Keep On Trading,

Mindset Advantage: Balance
When it comes to your mindset for trading, you’ll find that your ability to cope with the markets, bad trades, good trades – whatever – has more to do with how you spend your time outside of trading. More specifically, how much balance you have.
In fact, of your total state of readiness 10% may have to do with charts and price levels. The other 90% has to do with how rested you are. How focused you are. How happy you are.
Find a balance that works for you and begin the path towards happy trading.
Traders Training Session

Trading Longer Time Frames vs Shorter Time Frames Tutorial
Stay tuned for my next edition of Josh’s Daily Direction.
And if you know someone who’d love to make this a part of their morning routine, send them over to https://joshsdailydirection.
The post Is this your next golden trade opportunity? appeared first on Josh Daily Direction.


2 Comments
September 9, 2021 @ 12:59 am
it seems you post these a few days late ….any reason why ?
September 9, 2021 @ 3:20 am
Hi. Thanks so much for leaving us a comment. Students of our courses received analysis in realtime. Articles we publish are sent from our analysts to our copywriting team for polishing and then published for the public to read and enjoy. We hope you find value in our content, Happy Trading!!!