Today, I want to talk about a popular technical chart pattern that is often misunderstood by amateur and professional traders alike.
You’ve heard me talk about “flag” and “cup with handle” patterns before, which are great technical tools for navigating the market.
But the pattern that seems to get the most attention when it appears is always the “head and shoulders” pattern.
Here’s how it works and what folks often get wrong about it…
Head and Shoulders Spotlight
The head and shoulders pattern got its name, like many other patterns, because of the way it looks when it forms on a chart.
A flag pattern looks like and flag on a flagpole…
A cup with handle looks like a tea cup…
And a head and shoulders pattern looks like, well, see for yourself…
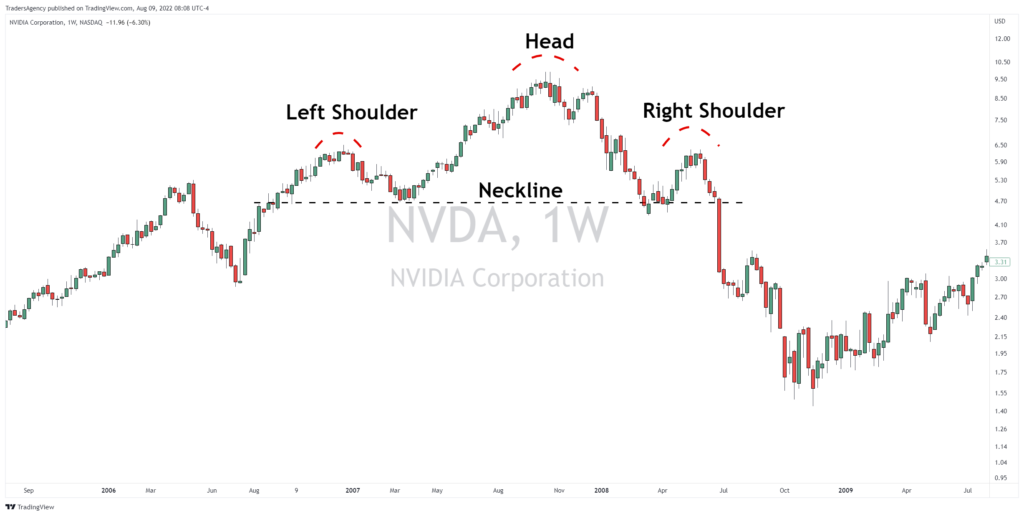
In the image above, you can see an older weekly chart of NVIDIA Corp. (NVDA) with a very clean head and shoulders example.
While it’s not necessarily anatomically correct, you can see that the pattern consists of a left shoulder, a head and a right shoulder, which are all tied together by the neckline.
The left shoulder is formed by the high price that comes before the peak. The head is formed by the price peak and the left shoulder is formed by the bounce after the peak.
Protect The Neckline
Now, perhaps the most important part of the head and shoulders pattern is the “neckline,” which acts as the support level for the pattern.
You see, the head and shoulders pattern is what’s called a bearish reversal pattern.
This means that the pattern is typically known for being a reversal pattern that ends a stock’s uptrend and sends it lower.
That was certainly the case for the NVDA example above… Once price broke through the neckline to the downside, price fell quickly.
Now, granted, this chart shows the drop into the Great Recession…
But it is still one of the best examples of the head and shoulders breakdown that I could find.
What Traders Get Wrong
The head and shoulders pattern can also be a continuation pattern, however.
In other words, the pattern doesn’t have to break down below the neckline. It can also continue to hold as support and send the stock higher…
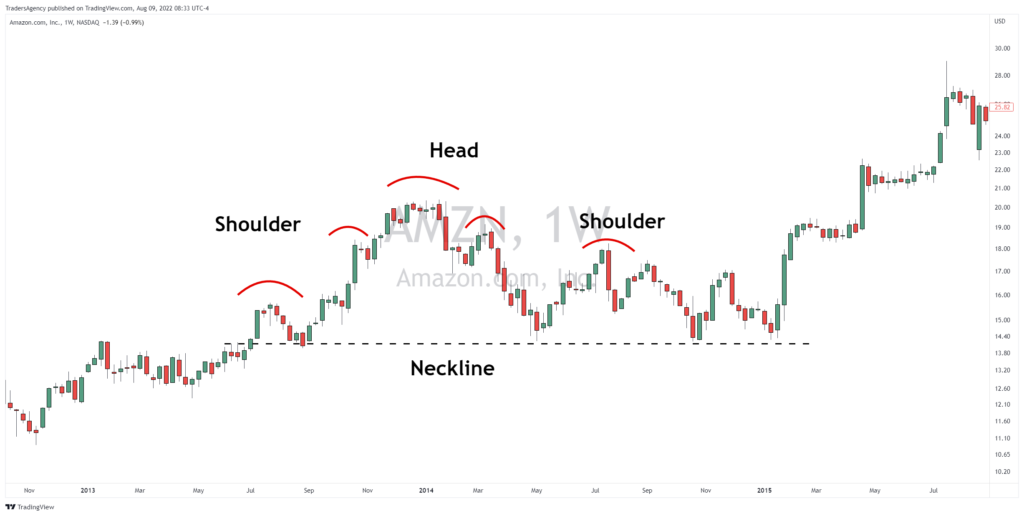
For a good example of this, check out the weekly chart of Amazon.com, Inc. (AMZN) above.
This was a more complex pattern with multiple shoulders — they’re not always perfect.
But that’s kind of the point… Instead of breaking down, price started to bounce around for a while after forming the right shoulder.
That created a bit of a messy example, but it perfectly shows why the neckline is so important…
A bearish reversal is much more likely to occur once or if the neckline is broken, while a continuation rally is much more likely to occur once or if the neckline is confirmed as support.
In the AMZN example above, of course, you can see how several successful retests of the neckline led to a continuation rally.
Insiders Lead the Way
Now, if you want a strategy for getting ahead of big market moves before they happen, consider this…
When corporate insiders like CEOs, CFOs, executives and board members put down their own hard-earned money to buy shares of their own companies, it’s a huge vote of confidence.
After all, these folks have a footing of knowledge about their companies that Main Street investors simply do not.
It’s absolutely free to attend, so I really hope you’ll check it out.
I’ll cover my strategy for trading alongside corporate insiders and generating potentially massive gains with less risk.
Just click here to register for this special Insider Effect LIVE session now!
Embrace the surge,

Ross Givens
Editor, Stock Surge Daily