Today, we’re going to follow up on last week’s “triple bottom” discussion by talking about its bearish counterpart, the “triple top” pattern.
Just like the triple bottom, the triple top is a trend reversal pattern.
The big difference, of course, is that a triple bottom forms at the end of a down trend, while a triple top forms at the end of an up trend.
Both are powerful chart patterns that can lead to big reversal moves, so let’s dive right in and take a look…
Charting the Triple Top
On a stock chart, a triple top pattern should show three clearly defined peaks.
For example, take a look at the daily chart of Intel Corporation (INTC) from 2003-2004 below.
The stock was coming off of a low price following the bursting of the tech bubble a few years earlier, and it was having a very strong bullish run…
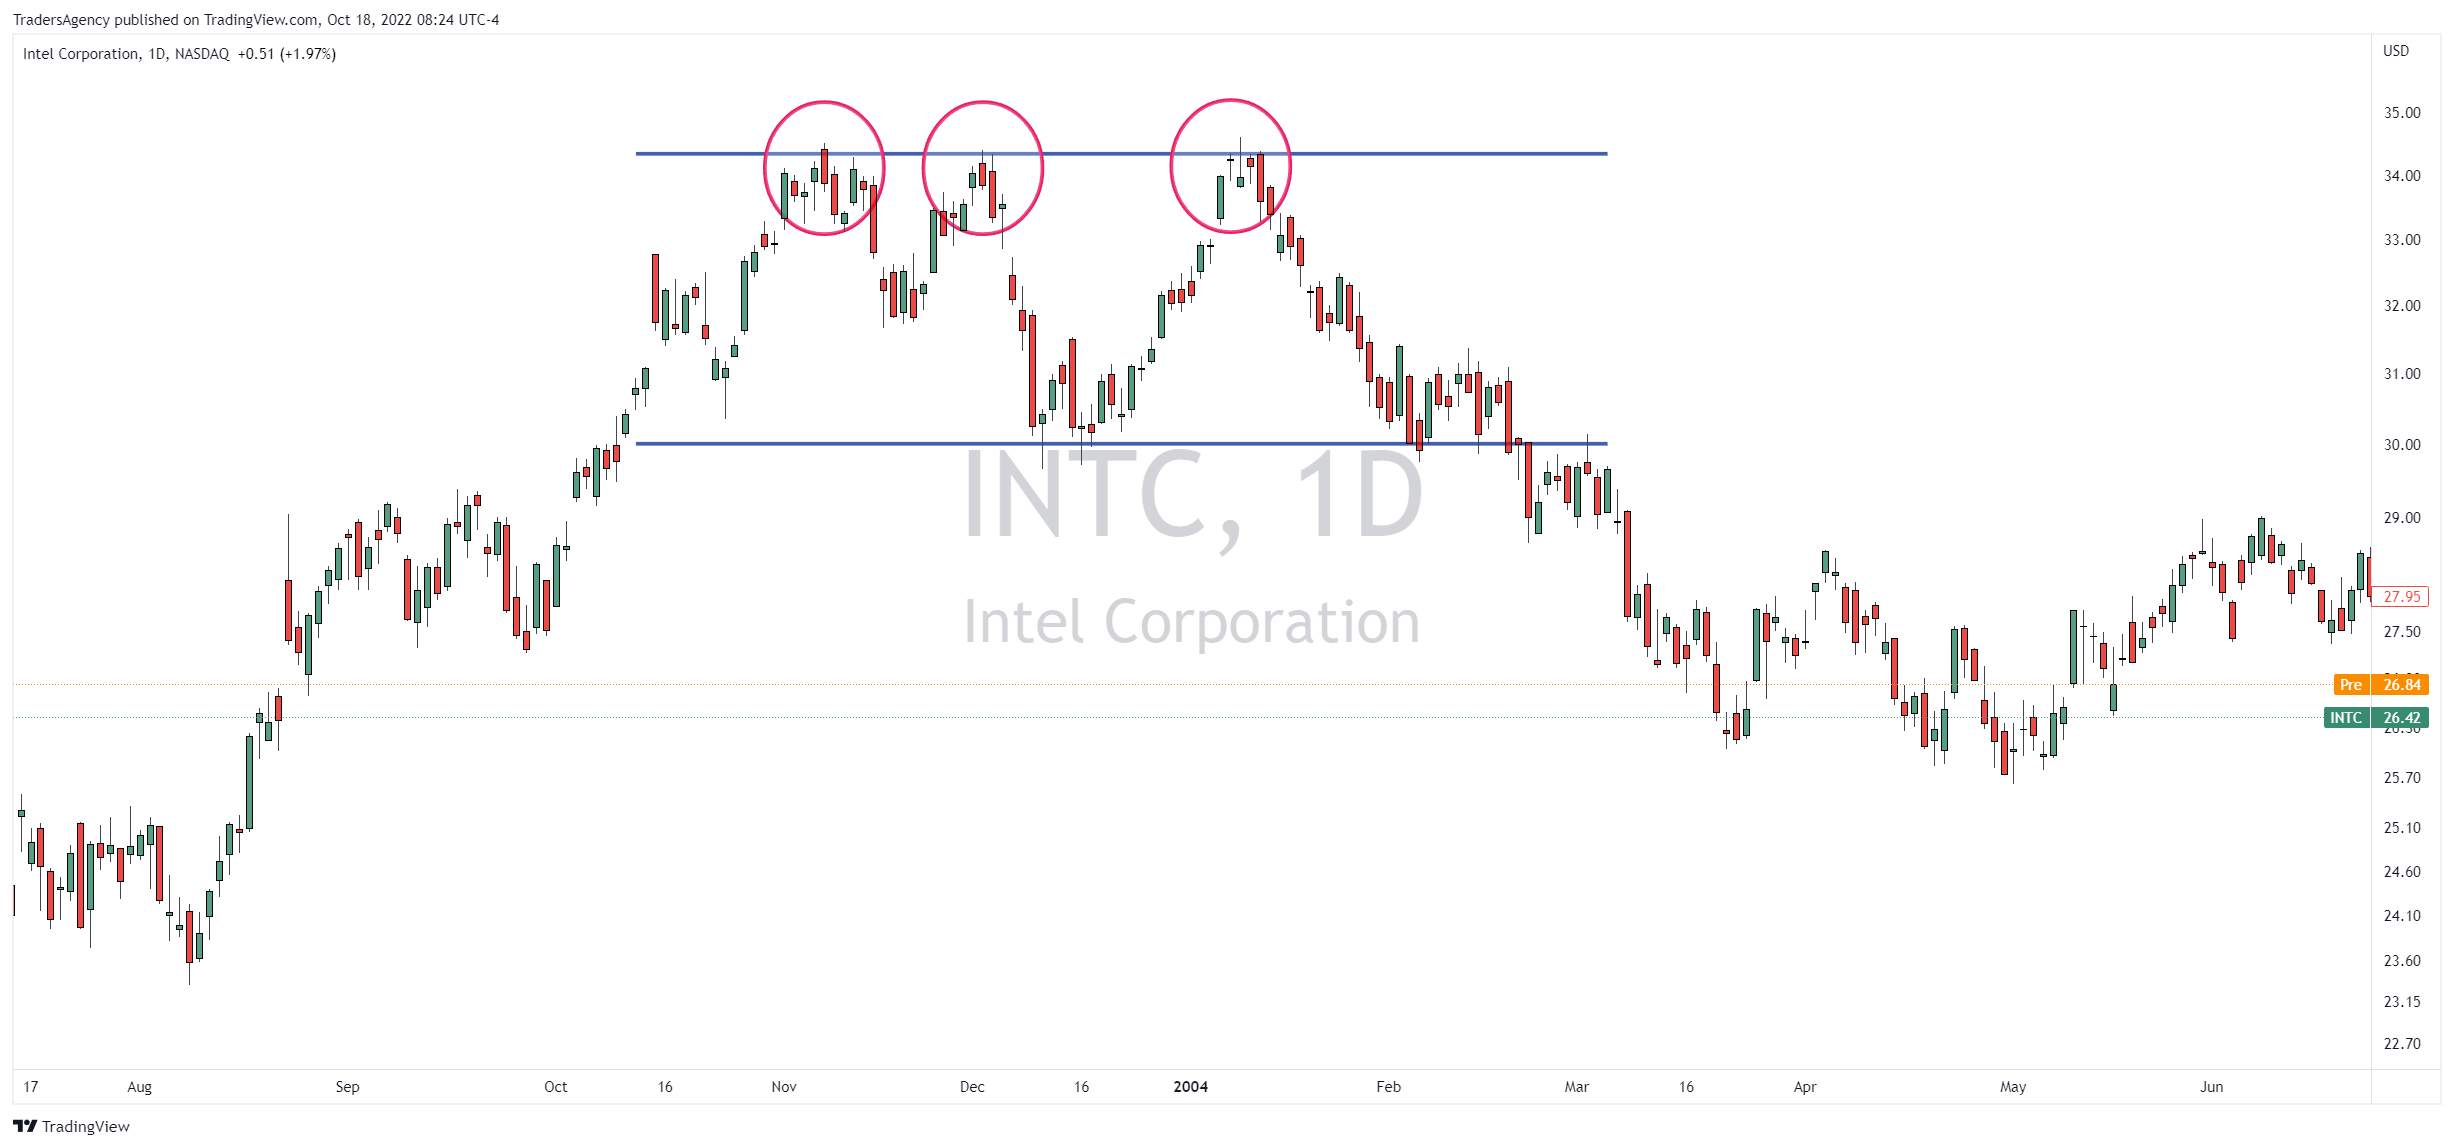
But in the chart above, you can see that INTC started to form a triple top pattern around in late 2003.
Identify the Boundaries
You will notice that I’ve drawn a resistance line from the top of the first peak and a support line from the bottom of the initial drop.
The triple top begins to form when the price touches overhead resistance for the third time. However, it is only confirmed once the price breaks below support.
As you can see in this example, price formed a third top in January 2004 as it was rejected at resistance.
It then fell back down to support just as quickly as it had rallied and consolidated for about two weeks.
Eventually, this triple top in INTC was confirmed when the consolidation resolved to the downside and price broke down through support in February.
Projecting the Pattern
While this opportunity is well in the past, the triple top pattern could be used in a couple of ways…
First, a bullish trader who had a position in INTC could have used a break of the support level as the stop for a long position.
On the other hand, a bearish trader could have used the break of support as an entry signal for a short position.
And if we were looking for a short idea, we could project the estimated price target based on the height of the pattern…
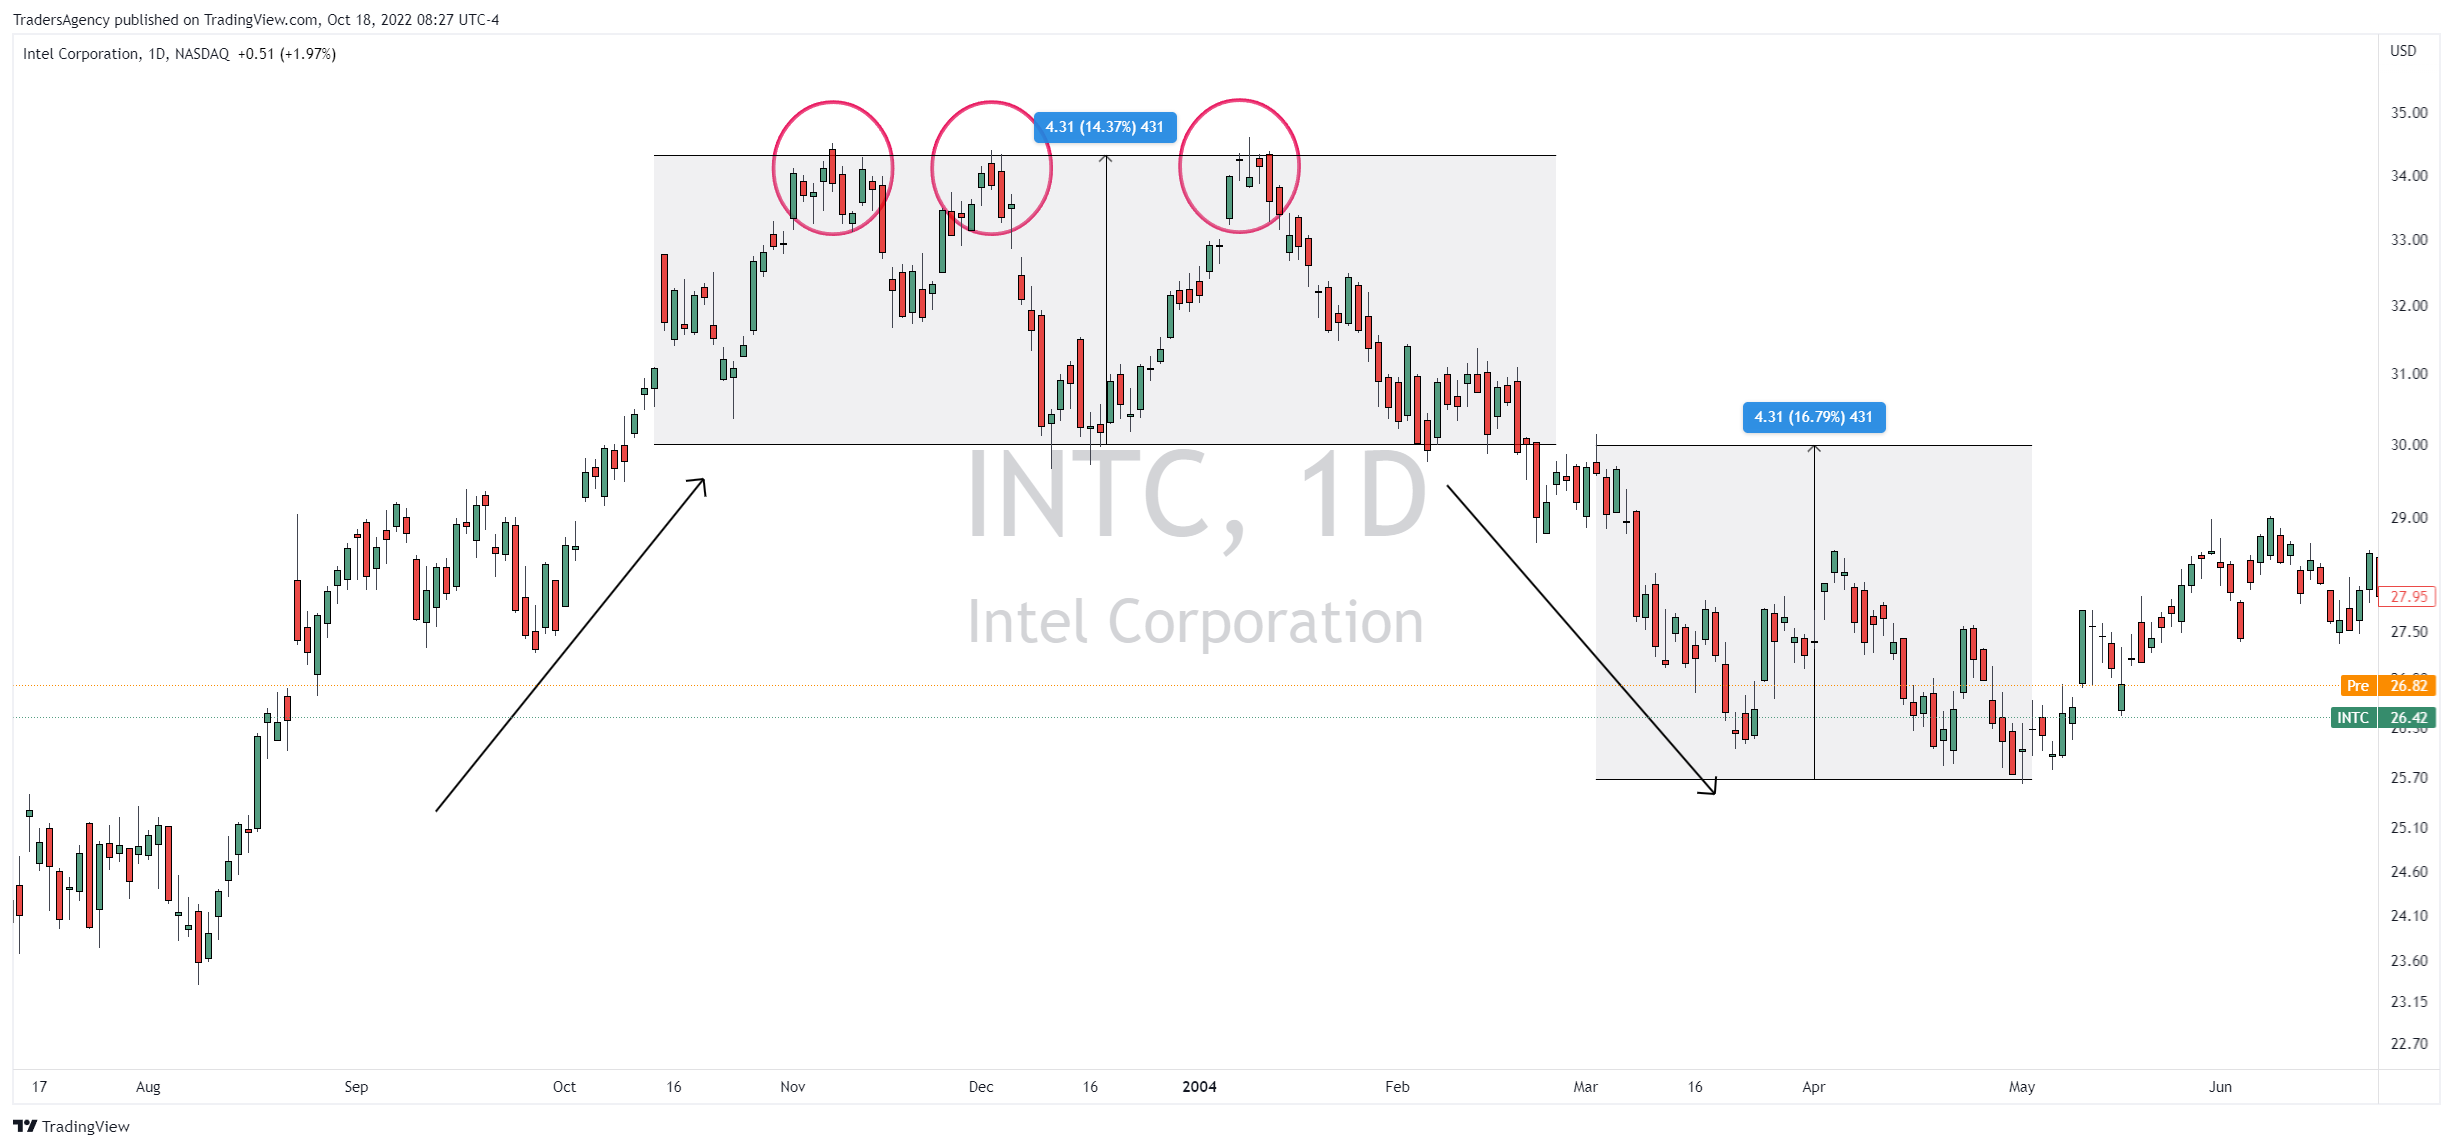
In this example, the height of the pattern is about $4.30 from top to bottom.
We then subtract that $4.30 from the price of the support level, which is about $30.
That gives us a potential price target of about $25.70 per share, or a further drop of almost 17%.
As you can see, that’s almost exactly what played out for INTC over the next several months before the stock found some short-term support.
Insiders Lead the Way
It’s clear that major trend reversal patterns like double and triple tops can lead to big moves in the stock market.
But if you want a more fundamentally driven strategy for getting ahead of big market moves before they happen, consider this…
When corporate insiders like CEOs, CFOs, executives and board members put down their own hard-earned money to buy shares of their own companies, it’s a huge vote of confidence.
After all, these folks have a footing of knowledge about their companies that Main Street investors simply do not.
It’s absolutely free to attend, so I really hope you’ll check it out.
I’ll cover my strategy for trading alongside corporate insiders and generating potentially massive gains with less risk.
Just click here to register for this special Insider Effect LIVE session now!
Embrace the surge,

Ross Givens
Editor, Stock Surge Daily