
More trouble is brewing in the world of digital currencies…
The rout in the digital asset market has been happening for a while, but we are now starting to see how plunging coin prices are affecting real companies in the space.
After suffering big losses in various coins, digital asset hedge fund Three Arrows Capital defaulted on a $600+ million loan to digital asset broker Voyager Digital (VYGVF) this week.
VYGVF had problems even before this week, but the news now has the stock down an incredible 98% from its all-time high set just over a year ago.
Elsewhere, digital asset lending platform BlockFi faced liquidity issues from the Three Arrows default, while another lender, Celsius Network, is facing rumors of insolvency.
Like many things in the digital asset space, they’re not so pretty when you look under the hood.
And the same is true for the BTC chart, which is what I want to cover today…
The Long-Term View
The long-term technical picture for BTC is defined by a series of massive price increases and subsequent crashes.
In the weekly chart below, I’ve identified each of the major bear moves over the past 10 years.
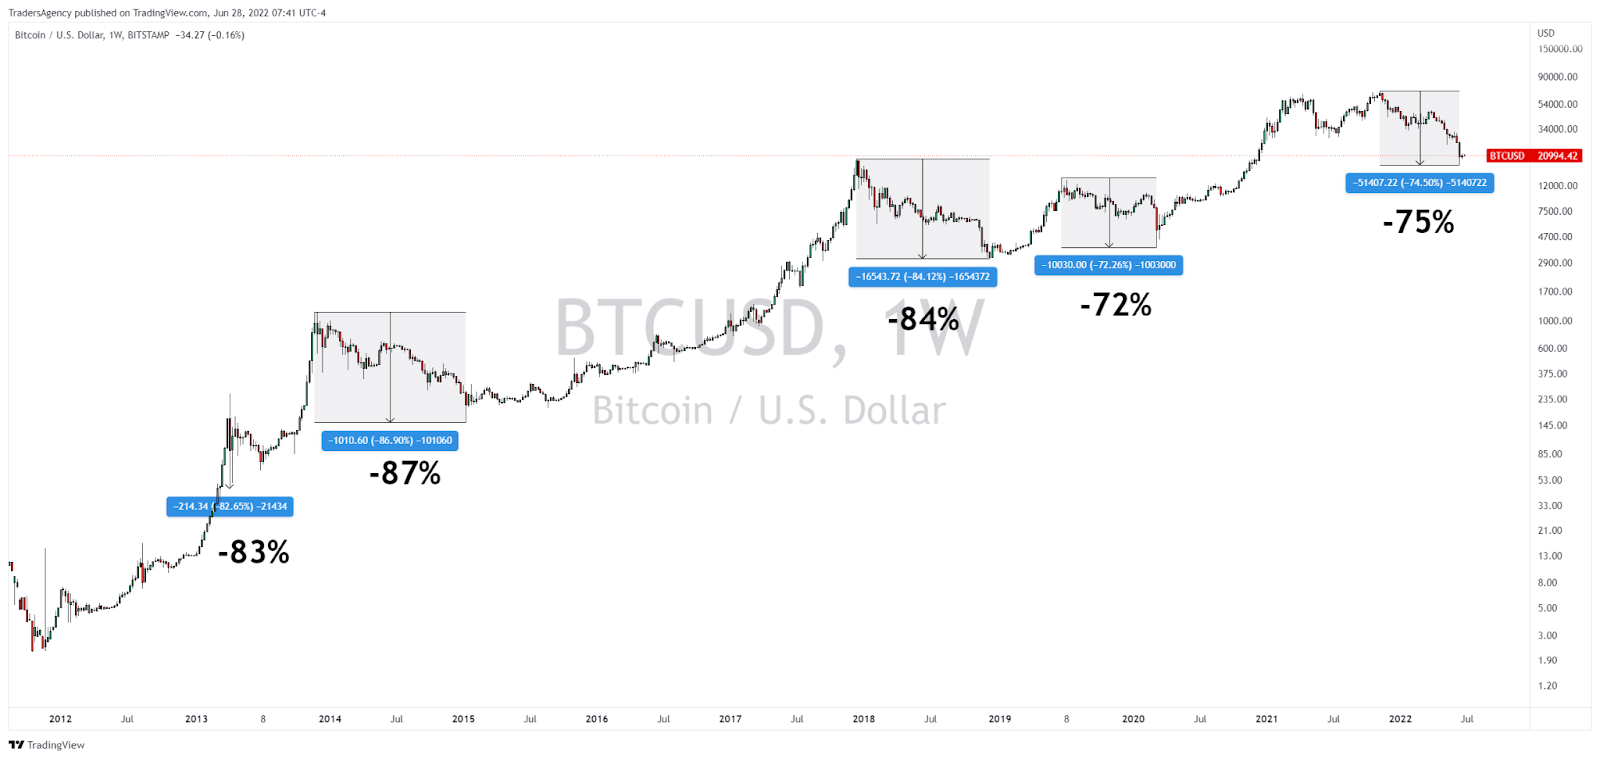
In 2013, the market experienced an 83% decline. From late 2013-2015, BTC fell 87%.
And after peaking out around $20,000 in 2017, BTC dropped 84%.
Then came the pandemic panic, which brought BTC down a less severe 72% between 2019 and 2020.
And finally, we come to today with BTC down nearly 75% from its 2021 all-time high.
So, what does this tell us about what could happen next?
Look Out Below
Well, the main thing it tells me is that there is still plenty of room to fall from a historical perspective.
Excluding the current decline, the average BTC bear market sees a decline of 81.4%.
If the current decline gets to that point, the price would be hovering just under $13,000.
And while you might at first think that’s no big deal, it actually represents a nearly 40% decline from current levels.
If the current decline matches the 84% plunge from 2017-2018, the price would be near $11,000.
And if the decline matches the 87% drop from 2013-2015, the price would be closer to $9,000 – more than 50% below the current price.
Keep that in mind as you think about buying the dip…
Zooming In
Now, let’s assume that we are seeing BTC put in a short-term bottom at current levels.
How high could it move from here?
Well, the market is up about 20% from its recent lows, but it hasn’t made much real progress in my view.
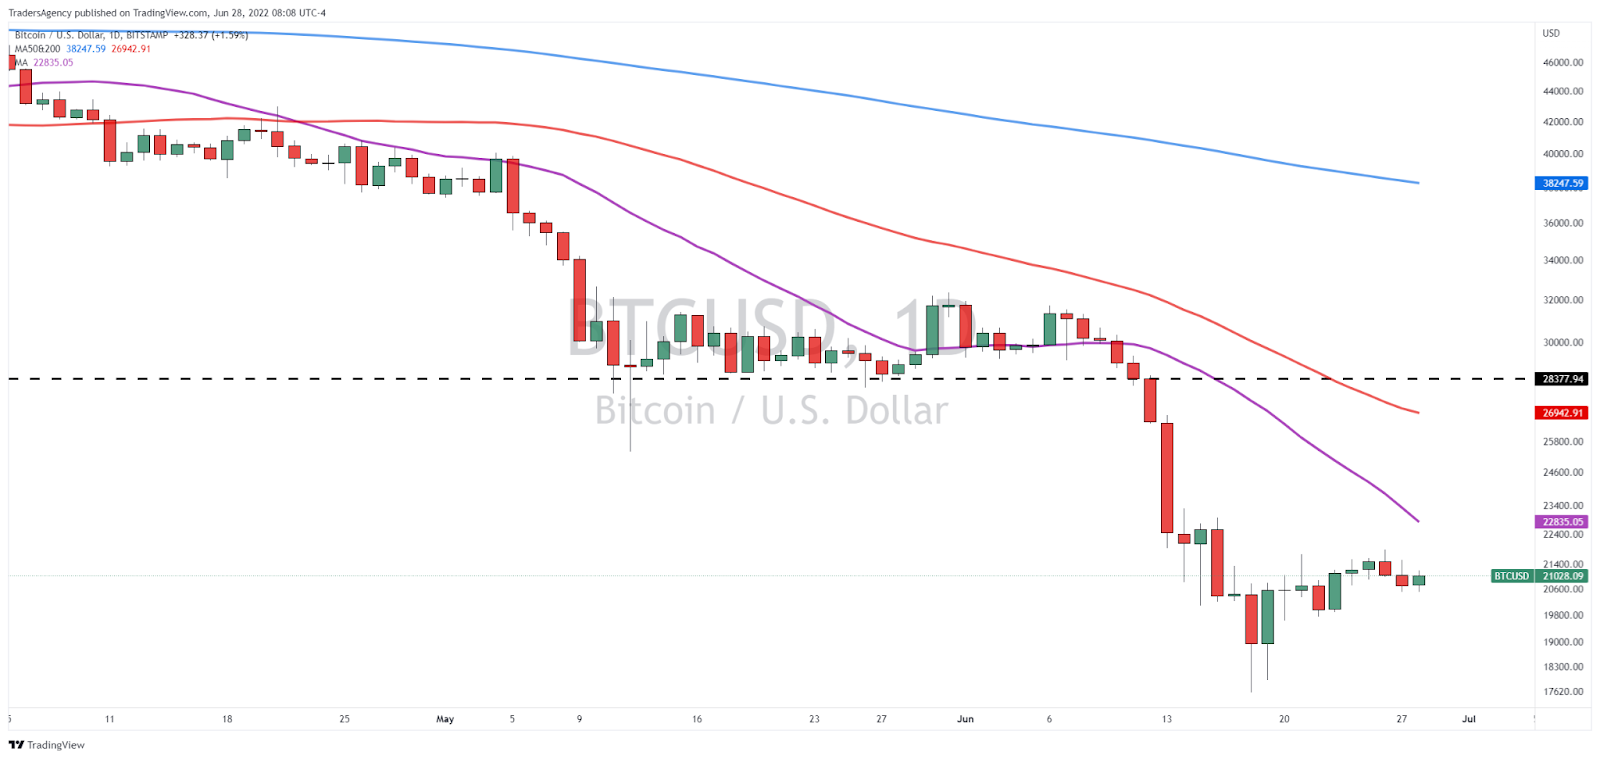
In the daily chart above, I’ve included the 21-day (purple line), 50-day (red line) and 200-day (blue line) moving averages.
First, notice that all three lines are pointing lower. That tells me that the short- and long-term trends are all bearish.
I don’t think we’ll see a bottom until the major moving averages at least flatten out and preferably start to point higher again.
Second, the market is still below all of those moving averages.
You can see that it tried to overcome the 21-day a few times last month, but it failed to hold, showing how weak the rebound attempts have been.
And finally, regular readers know that past support often becomes resistance…
Not only is that true for the moving averages overhead, which is where I often look to find great short entries when markets are falling…
It’s also true for regular technical levels like the major support level identified by the dashed line below…
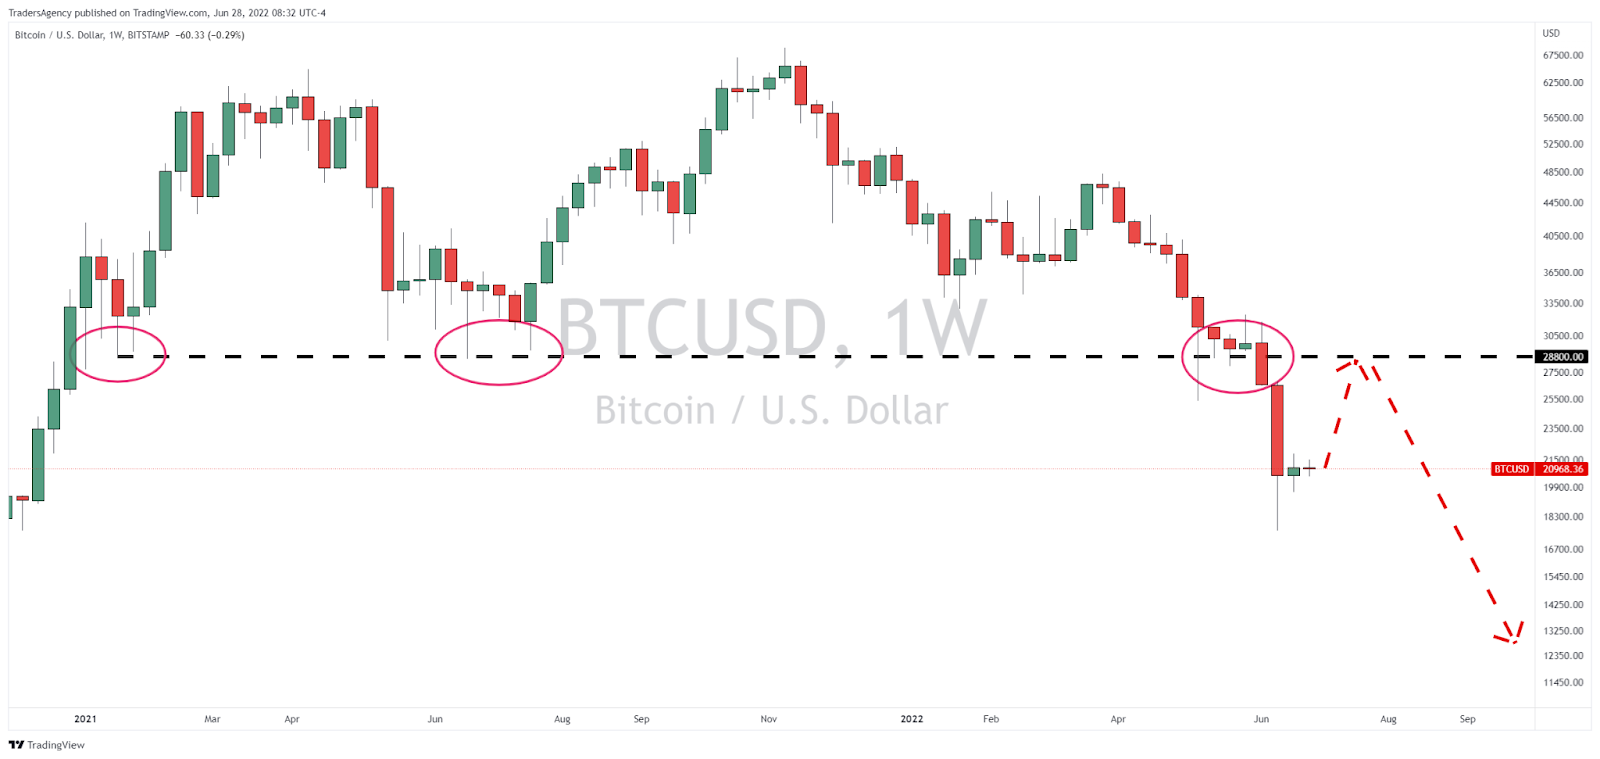
Going back to a weekly chart, you can see that the dashed line represents a key support level the market has respected numerous times over the past two years.
But when price finally broke below this level earlier in the month, this key support level became a new resistance level in my eyes.
If the market were to rally to that level, it would represent a gain of about 35%, which is not too bad.
However, when you consider the potential downside, which could be another 40%-50% based on the historical price action, the risk/reward picture doesn’t look so great.
When the chart firms up a bit better, I’ll take another look at the risk/reward picture.
But for now I continue to recommend extreme caution when it comes to buying digital currencies like BTC.
Join Today’s Live Session
Now, you’re looking for the next major move that has nothing to do with digital currencies whatsoever, consider signing up for today’s LIVE Alpha Stocks training session.
We have plenty of long ideas for the right stocks… We recently generated a gain of 21.3% in just 15 days in Permian Basin Royalty Trust (PBT) as that stock broke out of its range.
But we’re also not afraid to go short… As we also just recorded a 21.6% gain on the downside in only eight days as Pegasystems Inc. (PEGA) stock plunged…
And of course, we get together every Monday for an hour-long live session so that subscribers can ask questions and get guidance about our trades.
If you’re ready to see what you could be missing out on, I’m holding a special session this afternoon in which I’ll discuss my strategy in more detail…
Just click here to register and learn more about Alpha Stocks now!
Embrace the surge,

Ross Givens
Editor, Stock Surge Daily
The post Why BTC Has Further to Fall appeared first on Stock Surge Daily.


